Overview
How to use the KPI. Using the KPI is very strait forward. There are several options located in the top bar which we will go over.
There a many ways to configure your KPI
- Datatag
- Asset
- Text
- Scale
- Data table
- Chart
- New Channel
KPI Tools
| ||
|
| |
| Live mode on | |
| Offset mode when live mode is activated is will offset the live data in hte past by a set period. EG -5h would offset the data display 5 hours ago. | |
| Offset mode when live mode is deactivated. Will anchor the time | |
| After you have made changes to a KPI you will have hte option to save it or revert back to the last saved version of this KPI Note - If your not logged or don't have permissions to change the content you will still able to change the KPI but wont be able to save it and will loose your work | |
| This will Create a page in the Eigen Temporary space as a as a shared page. | |
| This will Create a page in the Eigen Temporary space using a KPI Template. | |
|
| Global setting |
Edit Variables Variables in a KPI allow a user to enter a value in one place and have it used by all the KPIs in the frame | ||
| Edit Config | ||
Edit Tags | ||
| Don't Prompt on 'Live Mode' toggle | ||
| ||
| Removes a row or column | |
| This button is located at the top of column or side of a row. Click and hold then drag onto another start of a column or row to swap the row or column | |
| Transpose flips the Rows with the respected Columns Transpose of a Matrix - A matrix which is formed by turning all the rows of a given matrix into columns and vice-versa. | |
| Adds another column to you KPI macro when grid is enables under Global settings. | |
| Adds another Row to you KPI macro when grid is enables under Global settings. | |
| ||


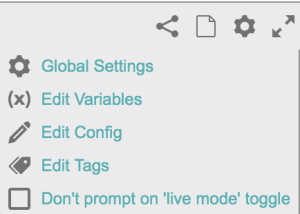


Table of Contents
Once you've added a KPI you'll need to customising it.
KPI Tools
Edit
Step 1
- First you'll need to take the KPI out of seamless mode if it is not all ready buy clicking the two arrows in circled in red.
Step 2
- Then toggle edit mode on
Configure KPI Environment
Once edit mode is on you have two ways to configure you KPI environment
- Grid Format
- No Grid Format
select the setting cog
Select Global Settings on the menu


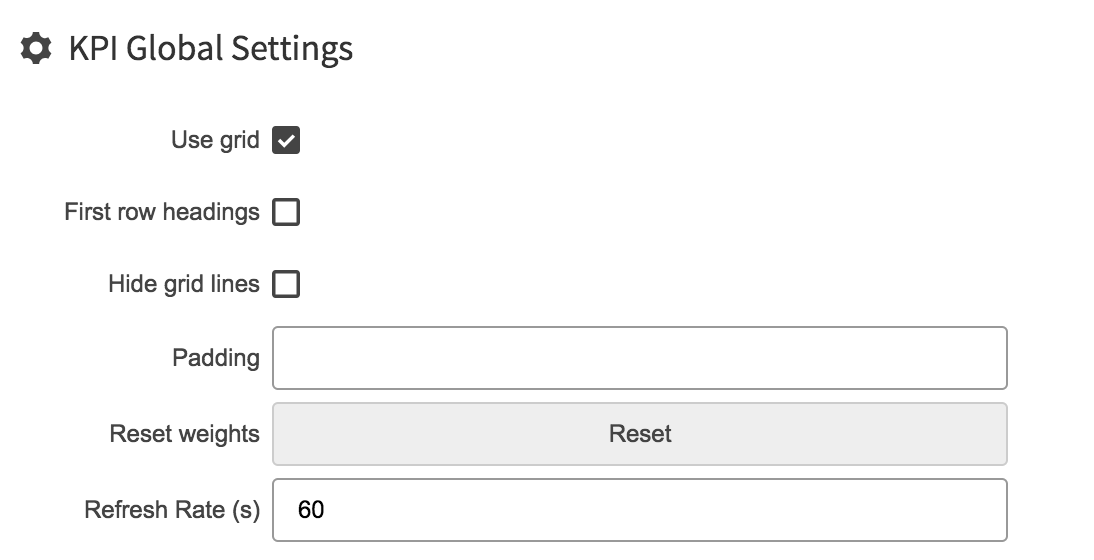
Grid Format
-Select Global Settings
So here we have a number of settings if
so here are the two styles use grid and don't use grid
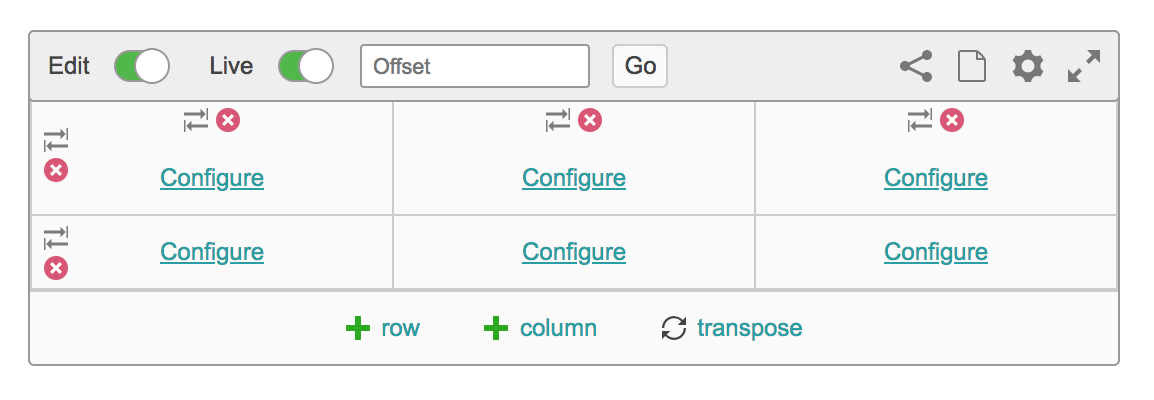
If you tick grid it will bring up a grid format where you can display data in a tabled format
-row button adds a row bellow the bottom row
-column button adds a column to the end of the far right column
-transpose swaps the rows with the columns (inverts it)
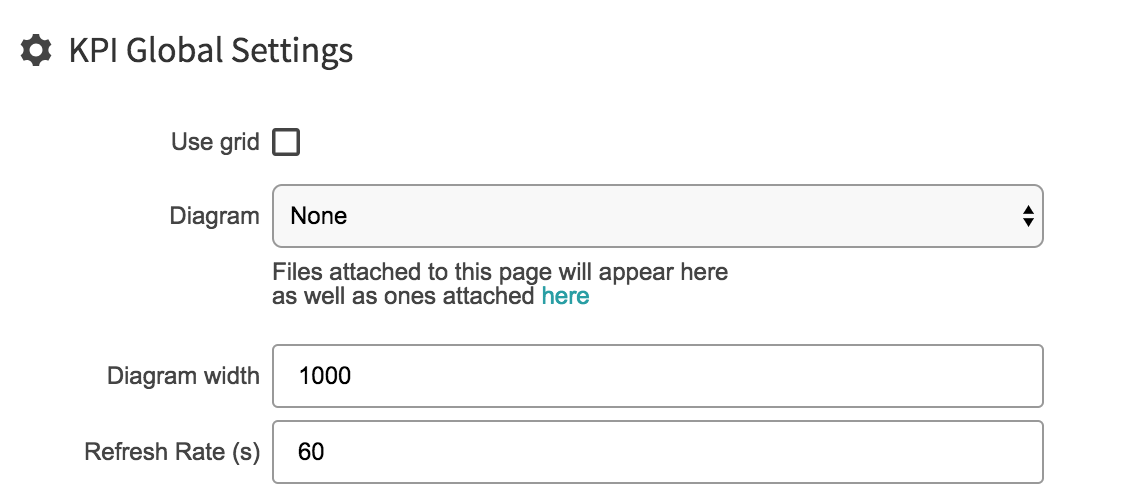
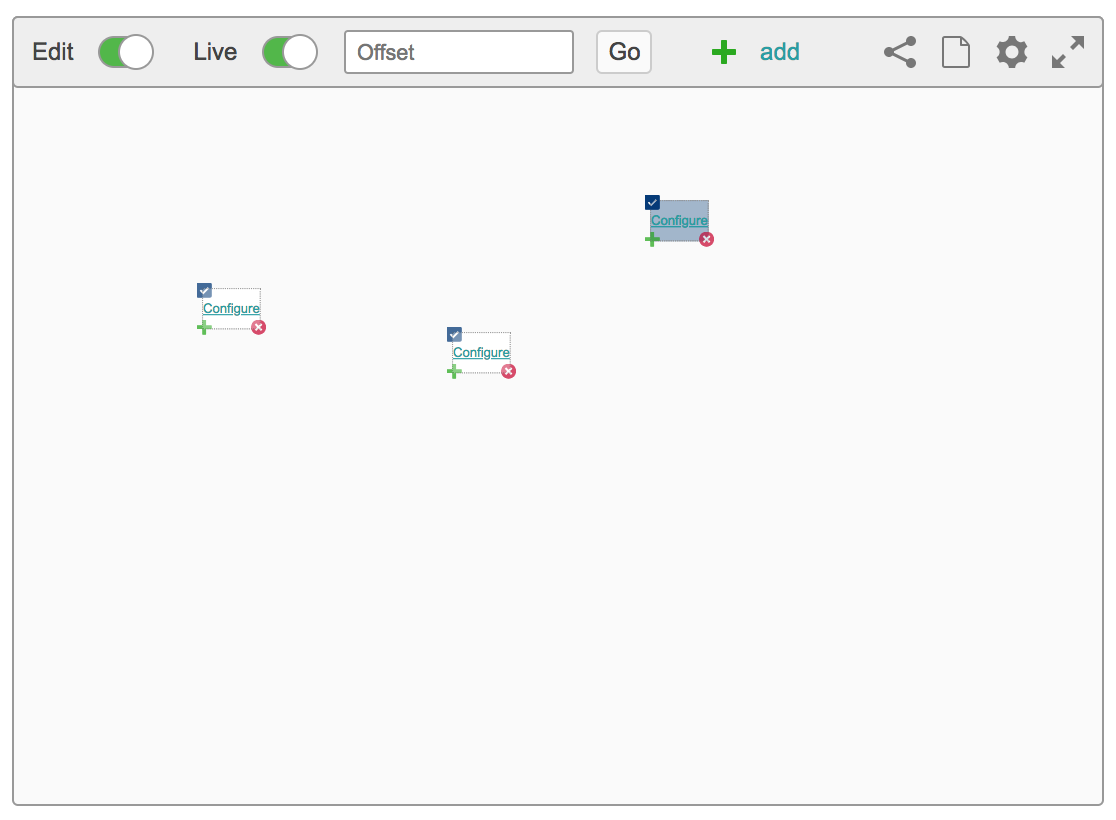
No Grid
If you untick grid you can freely place and move around your kpi objects
-Use add button to add elements to your kpi
With the no grid format you can import images and back ground images (ie svg diagrams, technical drawings etc) to go behind it and place you data on top of it like so
To save your work Click save and if you are not happy with what you have done you can click revert to go back to its last save

Share and Create Page
If you click the share or page icon it creates a page in the temporary space with this KPI on it - Eigen Temporary Space

Offset KPI

Edit Variables

Edit Config

Edit Tags

