Overview
Displays key performance indicators in a variety ways. It allows users to create displays containing simple numbers to a complex table. It has various charting, text, graphics and numerical views that can be combined to create a single view of numerous KPIs. Extremely useful when creating dashboards enabling users to see at a single glance what's happening.
How to use the KPI. Using the KPI is very strait forward. There are several options located in the top bar which we will go over.
Once you've added a KPI you'll need to customising it.
There a many different types of content you can add to to your KPI
- Datatag
- Asset
- Text
- Scale
- Data table
- Chart
- New Channel
Examples
Click on an Image to see in Full size


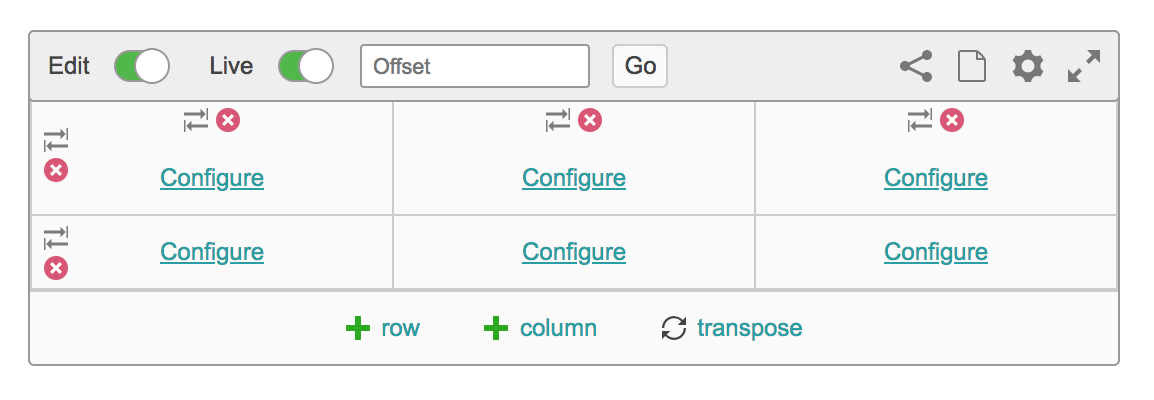
KPI Tools
| ||
| Edit Mode Switch
| |
| Live mode Switch
| |
| Offset Live Mode ON
| |
| Offset Live Mode OFF
| |
| Save and Revert
Note - If you're not logged in or don't have permissions to change the content you will still able to change the KPI, but won't be able to save it and will loose your work | |
| Share Page
| |
| Create Page
| |
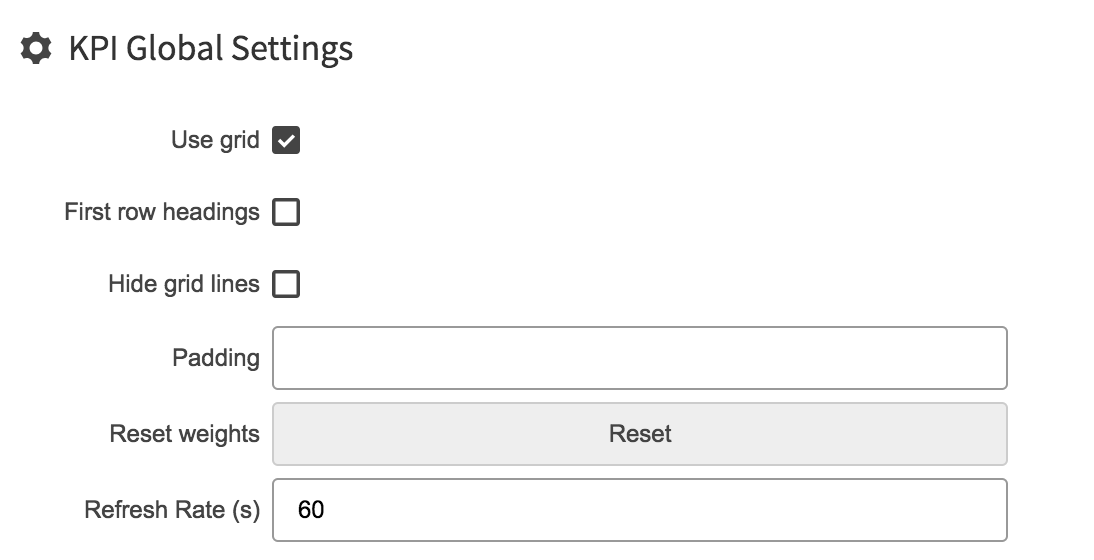
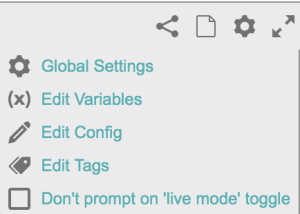 | Global setting
Once edit mode is on you have two ways to configure you KPI environment: 1. Grid Format
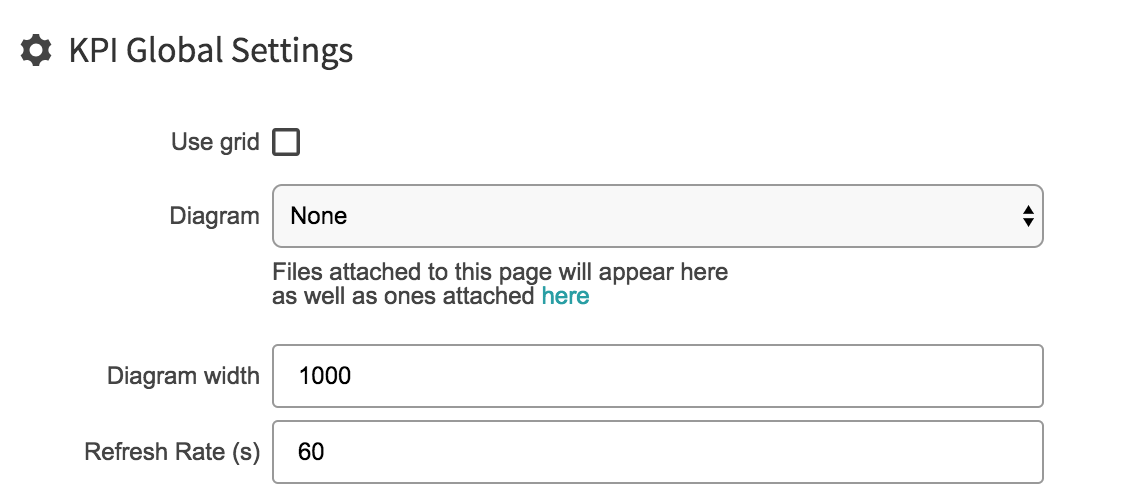
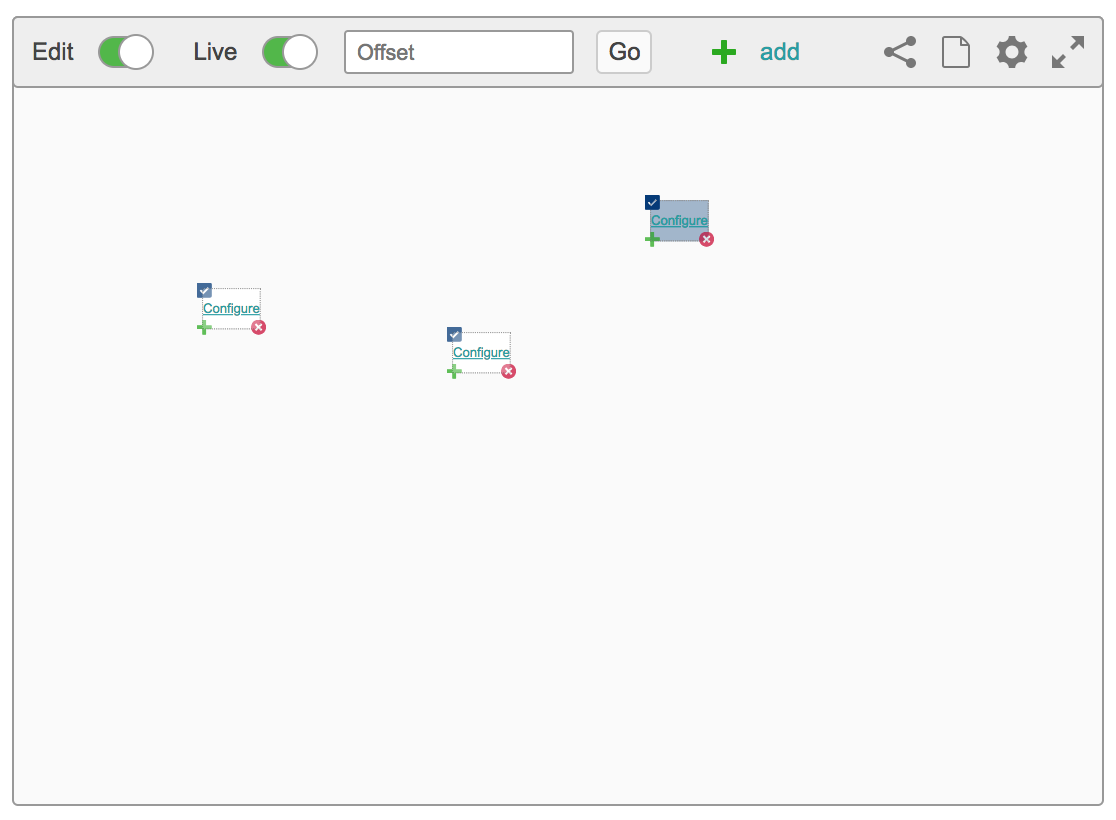
2. No Grid
| |
Edit Variables Variables in a KPI allow a user to enter a value in one place and have it used by all the KPIs in the frame | ||
Edit Config This were you can view and edit the configuration code of the KPI.
| ||
Edit Tags
| ||
| Don't Prompt on 'Live Mode' toggle | ||
| Seamless Mode
| |
| Delete Icon
| |
| Move Column or Row
| |
| Transpose
| |
| Column
| |
| Row
| |
| Configure
| |
| Z key Use the 'z' key to copy configured elements with in your KPI
| |