Overview
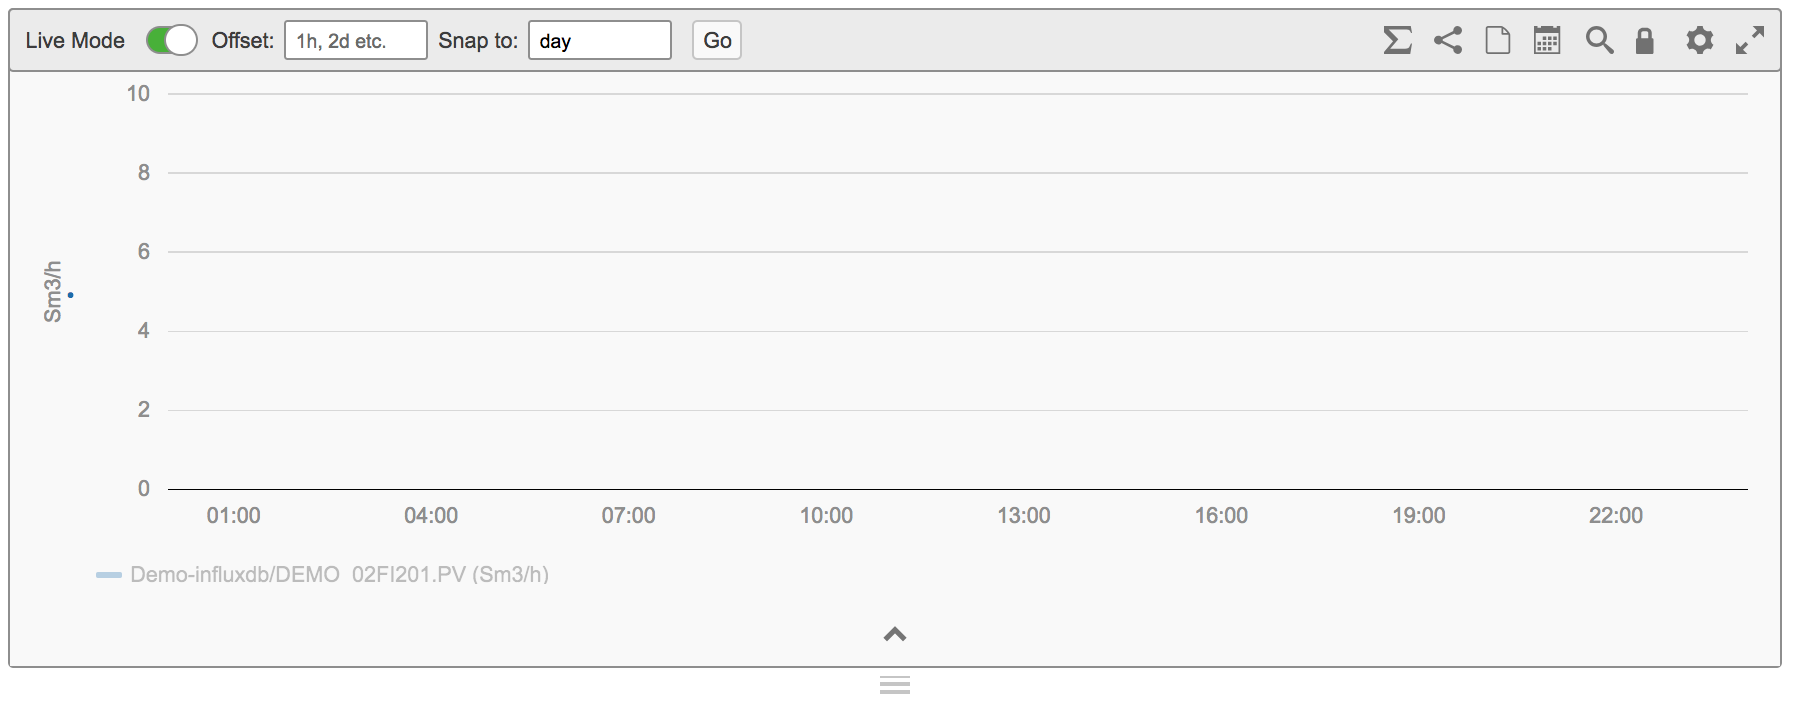
The Chart Macro. Create one or more interactive trends with different y-axes, scales, time ranges and layouts.
Chart Tools

| Share the chart. Creates a trend in the temporary space that can be shared with other users - Eigen Temporary Space |
| Create Page with the Chart. Creates a page with the chart on it in the temporary space. This page can be modified and moved in your personal space or moved into a production space. - Eigen Temporary Space |
| Put The whole Chart macro into seamless mode. Seamless mode removes all the editing tools and only displays the chart on the page. |
| Edit Config. This allows you to see the config file behind the trend. Copy this and paste it into a text editor to make larger changes. |
| Edit Tags - Used for defining a template version - Template |
| Changes the hight and the width of the whole chart
|
| Edit Variables |
| Chart Layout
|


Trend Tools
These Tools edit individual Trends where as the tools above will edit all the charts if you have set multiple charts to be displayed

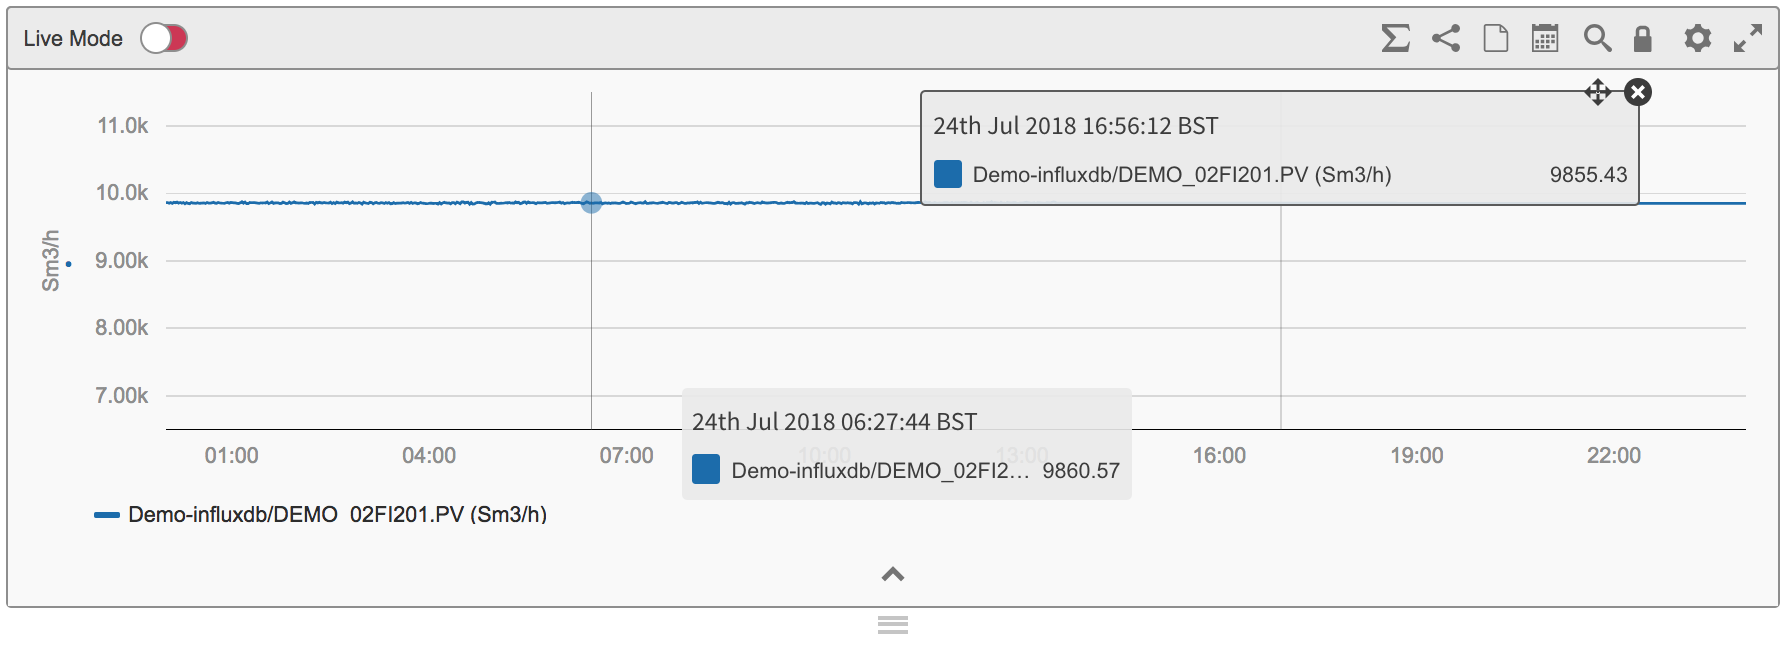
| Live mode (ON = the data is constantly updating with time, OFF = the trend will stay displaying the time area that has been a set displaying a snap shot of data in the past.) |
| Offsets the trend data by the set amount of time (EG 1h means 1h in the past) |
| Snaps the trends X axis to a time period. Valid syntax - hour, day, month , year (no numbers are valid only the words) |
| Changes the trend to a scatter plot. Check how how two tags data relates. |
| Shares this individual trend Trend. Creates this trend in the temporary space that can be shared with other users. - Eigen Temporary Space |
| Creates a page in the temporary space with this individual trend. Creates a page with this trend on it in the temporary space. This page can be modified and moved in your personal space or moved into a production space. - Eigen Temporary Space |
| Use a set time span from a start time to a end time or use a time span of a specific time period such as one day or five hours. Valid syntax is minutes hours and days with a value in front of it 1m, 1h, 1d
|
| Opens the trend in a full screen pop up window |
| Use to lock and unlock the trend area so you can zoom and scroll axis (time and magnitude). |
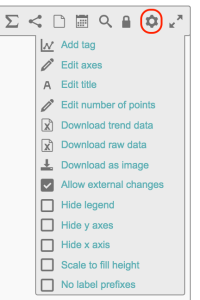
| Opens up the trend settings Here You can:
|
| Puts the trend into seamless mode |
| Add a tag to the chart, either drag from an addiotn trend or from a kpi or form the basket. Or add a tag under setting cog "Add tag" |


Editing the Plot
To edit a trend line click the arrow up to bring up the trend configure


| Coloured square | Allows you to change the colour of the trend line. Change the weight of the line Change the style of the trend line |
|
| Name | Tag Name | |
| Description | Meta data description | |
| Units | Meta Data tag Units | |
| Count | number points on trend | |
| Format | auto, normal, scientific | |
| Axis | left 0, left 1, left 2 Right 0, Right 1, Right 2 | Moves the trend onto different axis. Trend multiple tags using different axis for each category of data |
| Data Type | Interpolated, Raw, auto | |
| Plot Type | smooth, steped before, stepped after | |
| End Date | any, custom | |
| Trash Can | Remove the Trend from the chart |

Right Clicking on the Tag name

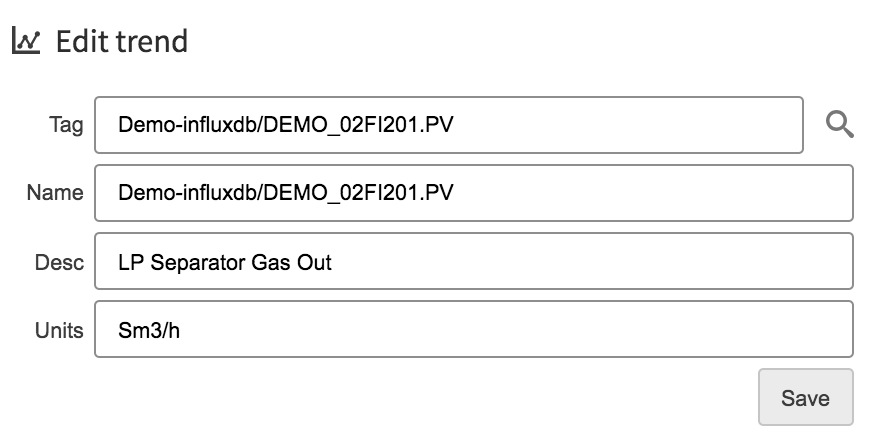
| Edit | Allows you to edit the trend. Change the name that is displayed in the X axis and edit its description and units
|
| Edit Calc | Opens up the calculation editor if trending a calculation |
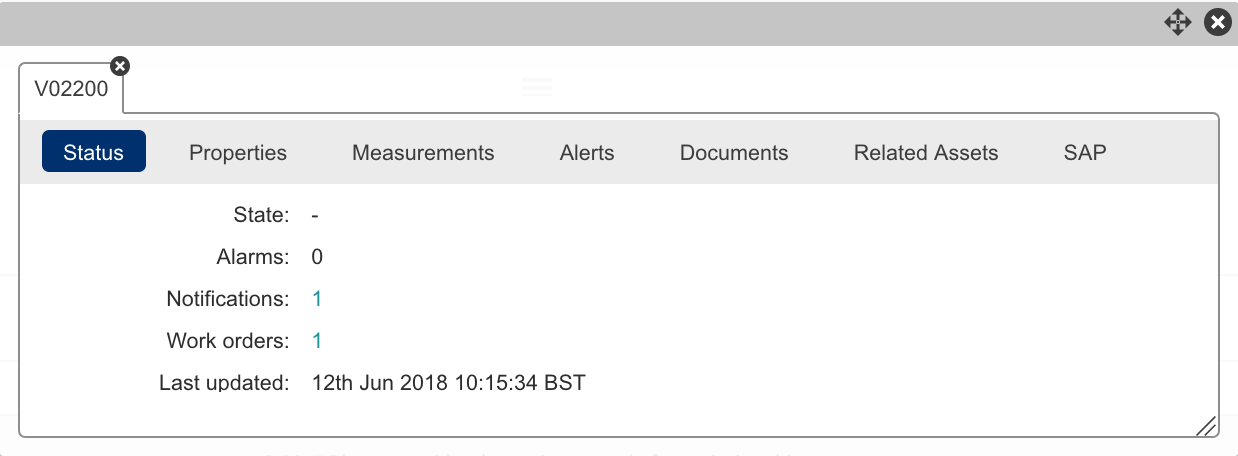
| Common Menu | Brings up the common menu for its parent asset of the tag |
| Add to Basket | Adds the trend to the basket |
| Add alias | |
| Sunburst | |
| Trend | Opens a full screen pop up of the that individual trend thats been selected |
| add Trend AVG | Plots a trend that shows the average in the past 10 minutes (SLIDINGAGG(Demo-influxdb/DEMO_02FI201.PV,AVG,10m) |
| Add Trend MIN | Plots a trend that shows the Minimum in the past 10 minutes (SLIDINGAGG(Demo-influxdb/DEMO_02FI201.PV,MIN,10m) |
| Add Trend MAX | Plots a trend that shows the Maximum in the past 10 minutes (SLIDINGAGG(Demo-influxdb/DEMO_02FI201.PV,MAX,10m) |
| Add Trend STDDEV | Plots a trend that shows the Standard Deveration in the past 10 minutes (SLIDINGAGG(Demo-influxdb/DEMO_02FI201.PV,STDDEV,10m) |
| Copy to Local Trend | |
| Remove Trend | Removes trend from chart |
| Edit Limits | Allows you to edit or create new limit alerts for this tag or calculation |
| Edit Labels |
Right Clicking on the trend Line

| Add Tag | Add another trend to the chart |
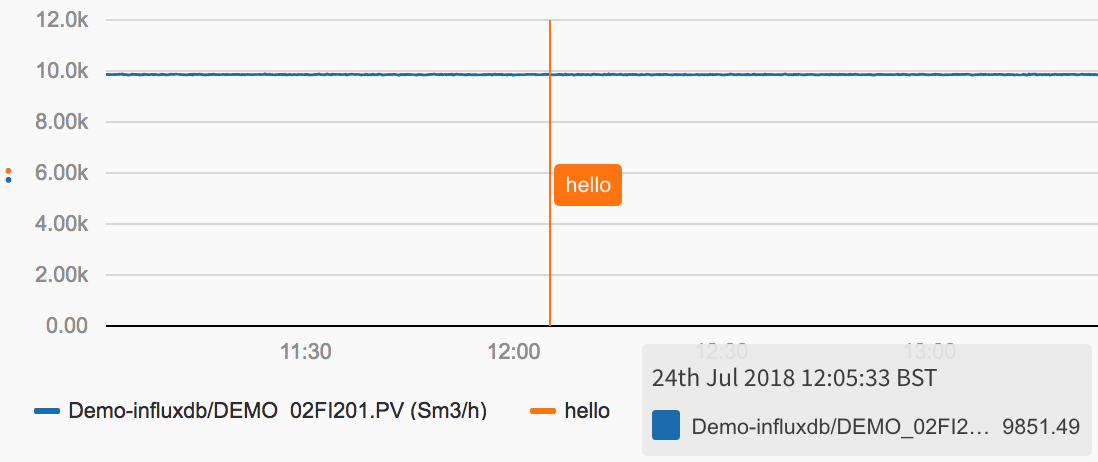
| Add Marker | Adds a marker to the chart at the time stamp your curser was at
|
| Add all to basket | Adds all the trends on this chart into the basket |
| edit axes | Edit the Y axis Edit |
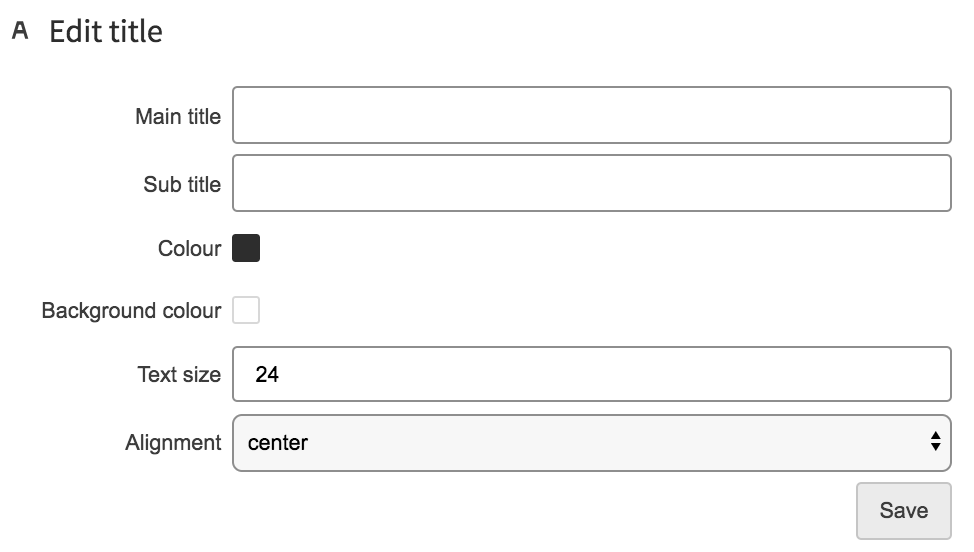
| Edit Title | Allows you to add a title and a sub title
|
| Download Trend Data | Down loads the trend data that is being displauing on the chart in the format selected |
| Download Raw Data | Down loads the the actual raw data thats been entered from the historian |
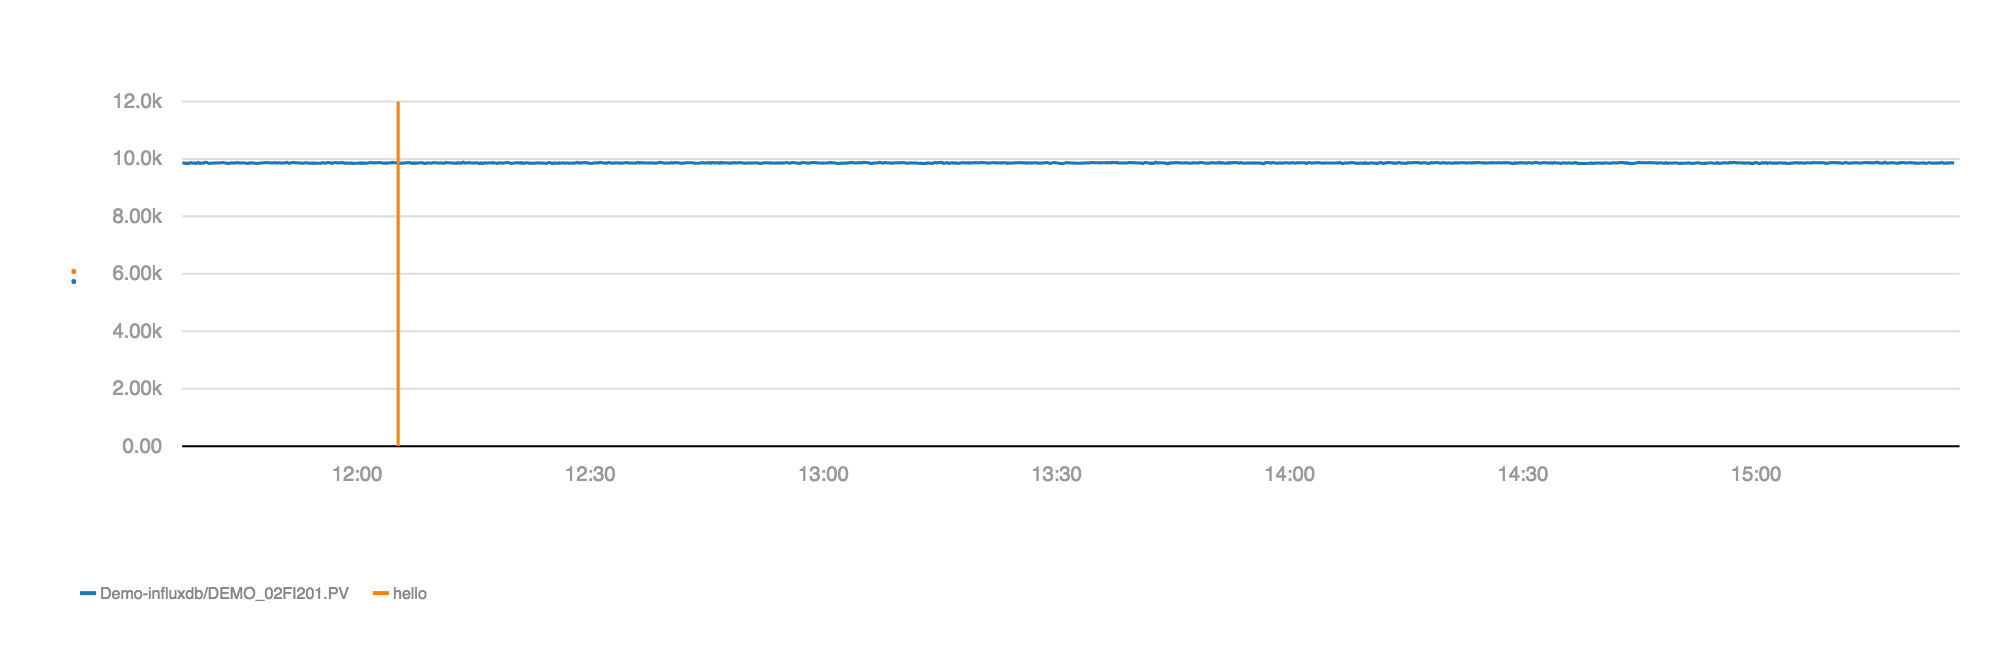
| Download as Image | Downloads a png image of the chart
|
Tips
- Pressing the space bar with your curser on the chart will take a snap shot of the data at that time and display a pop of it that can be moved around.
- Clicking on the trend will remove it from the display until you re click on it.