Table of Contents
Lets calculate the Log mean Temperature difference on a heat exchanger.
The calculation is this
LMTD = ((Temp Hot Inlet - Temp Outlet Cold) - (Temp Outlet Hot - Temp Inlet Cold)) / LN ((Temp Hot Inlet - Temp Outlet Cold) - (Temp Outlet Hot - Temp Inlet Cold))
#Previously when building calculations you would build them external from the system that the calculation is going to run in.
NOTE - We are going to build this calculation using the Chart macro that is accessible in the Basket by selecting Trend. The method is exactly the same for building it in a KPI
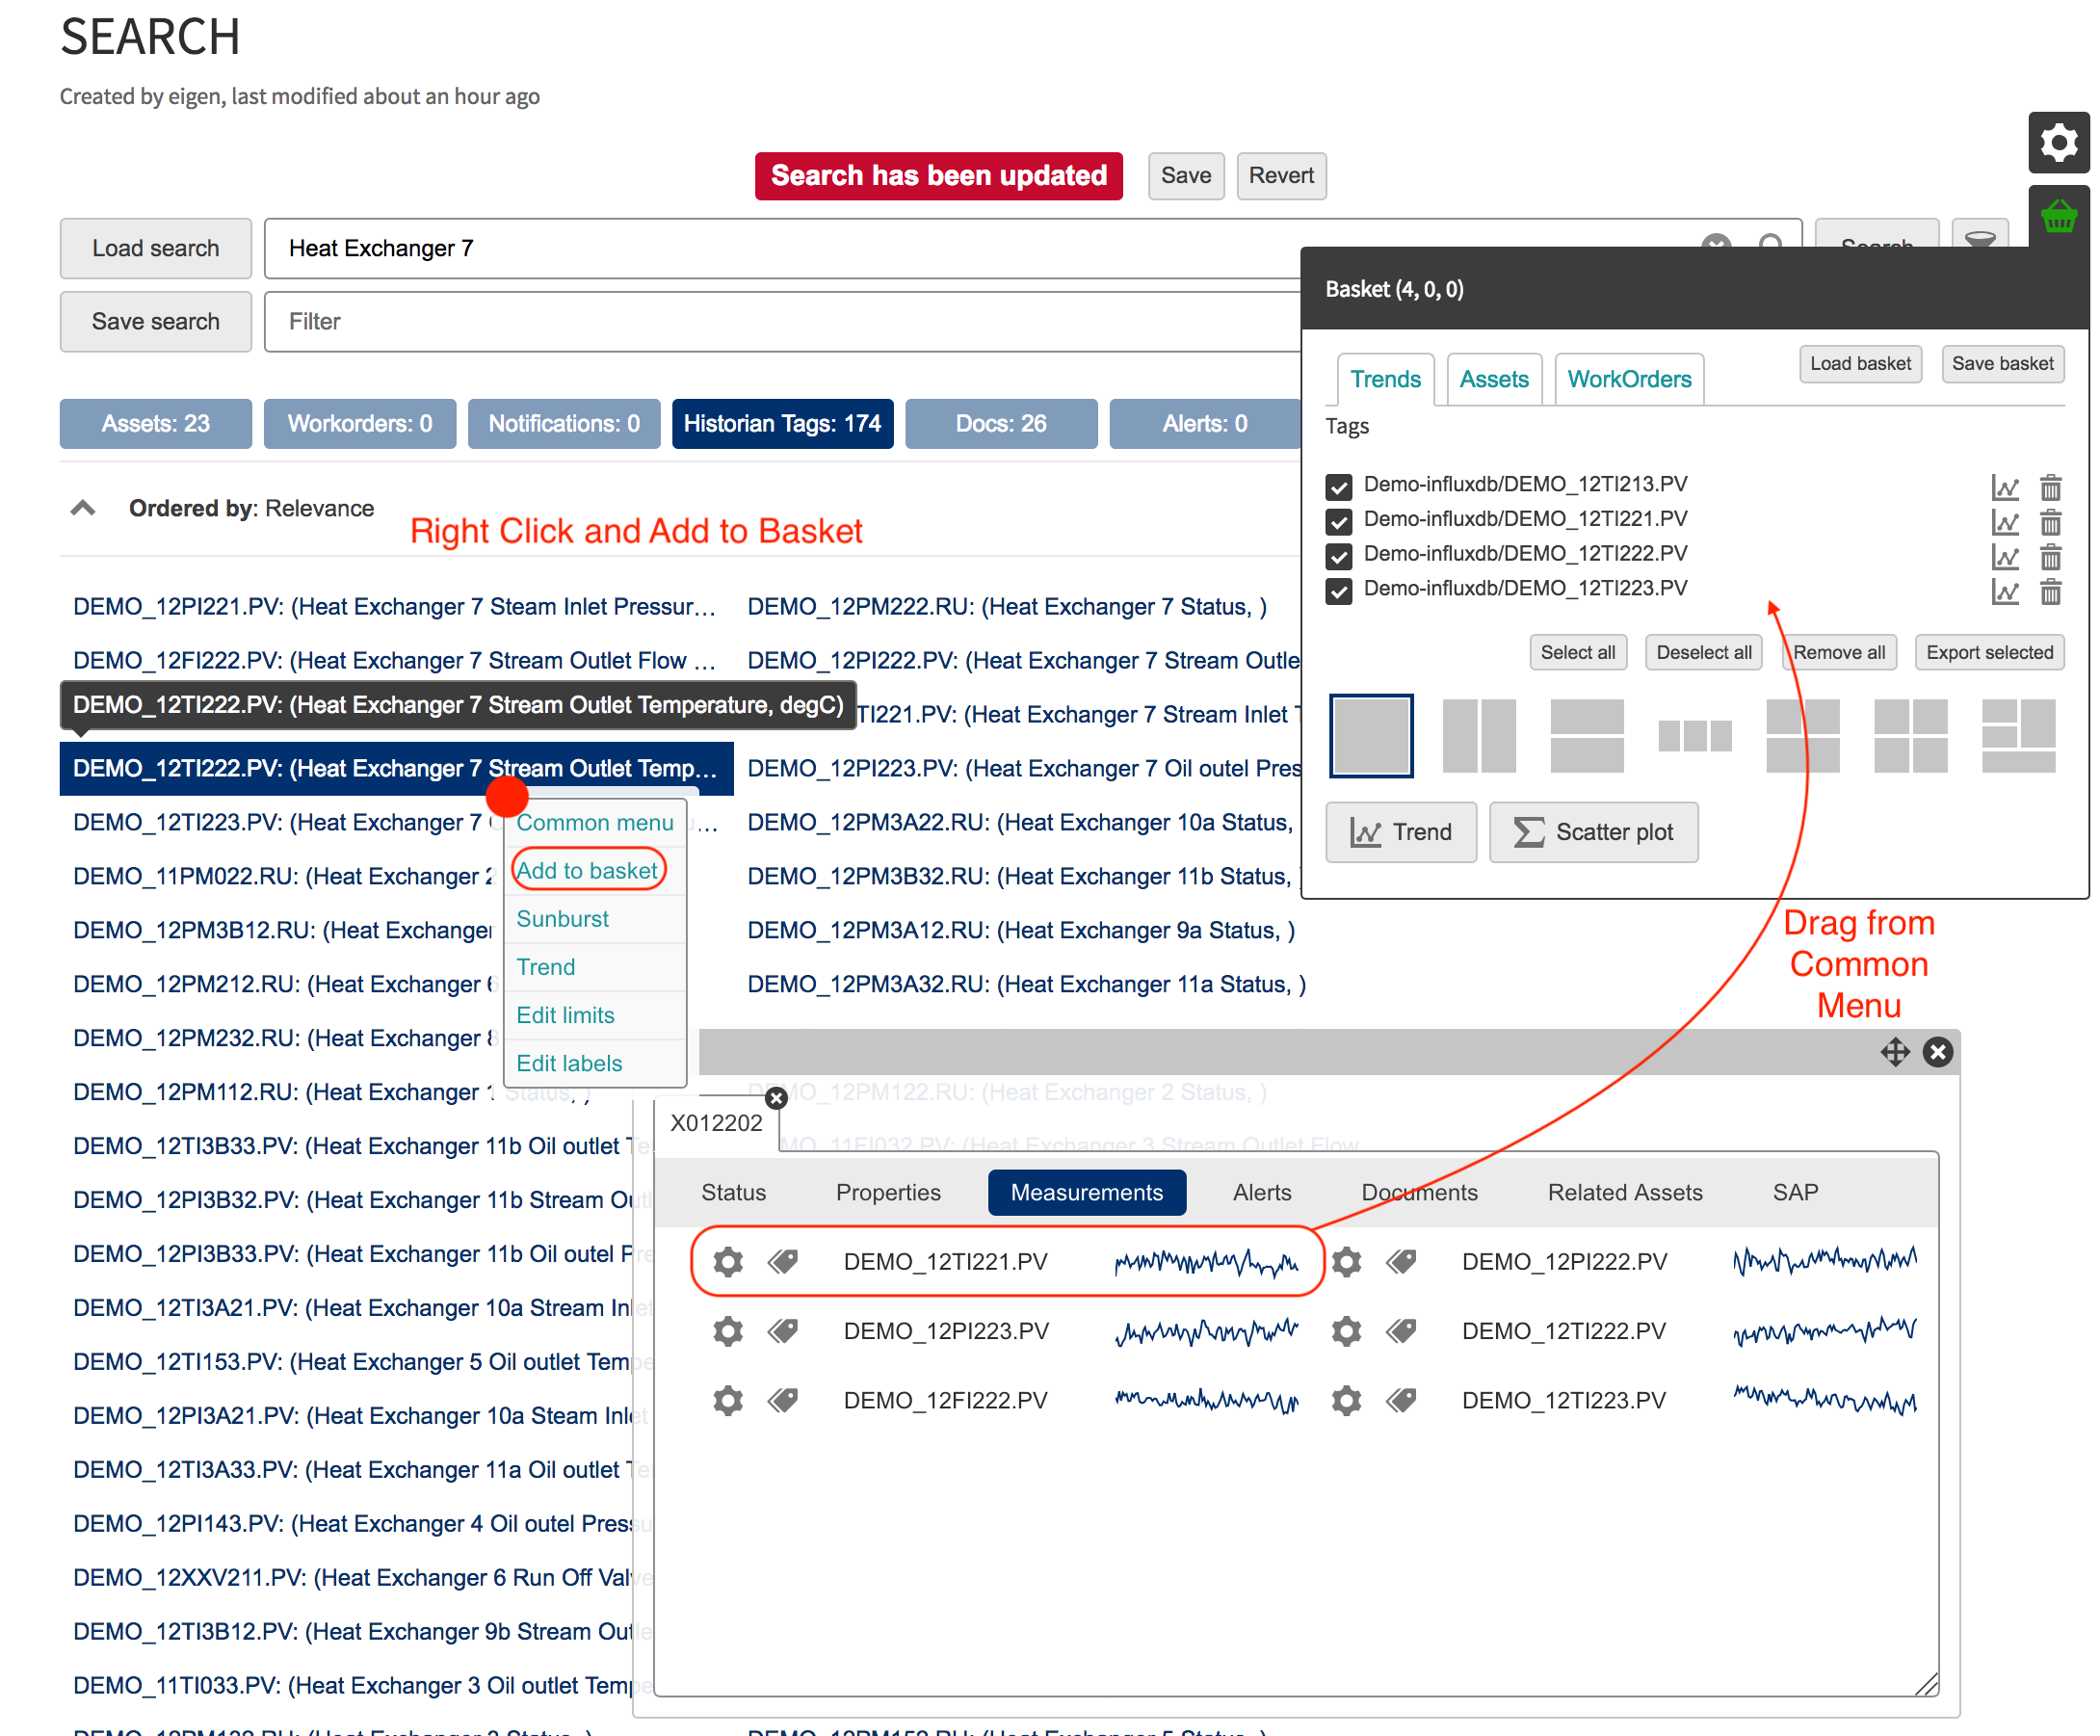
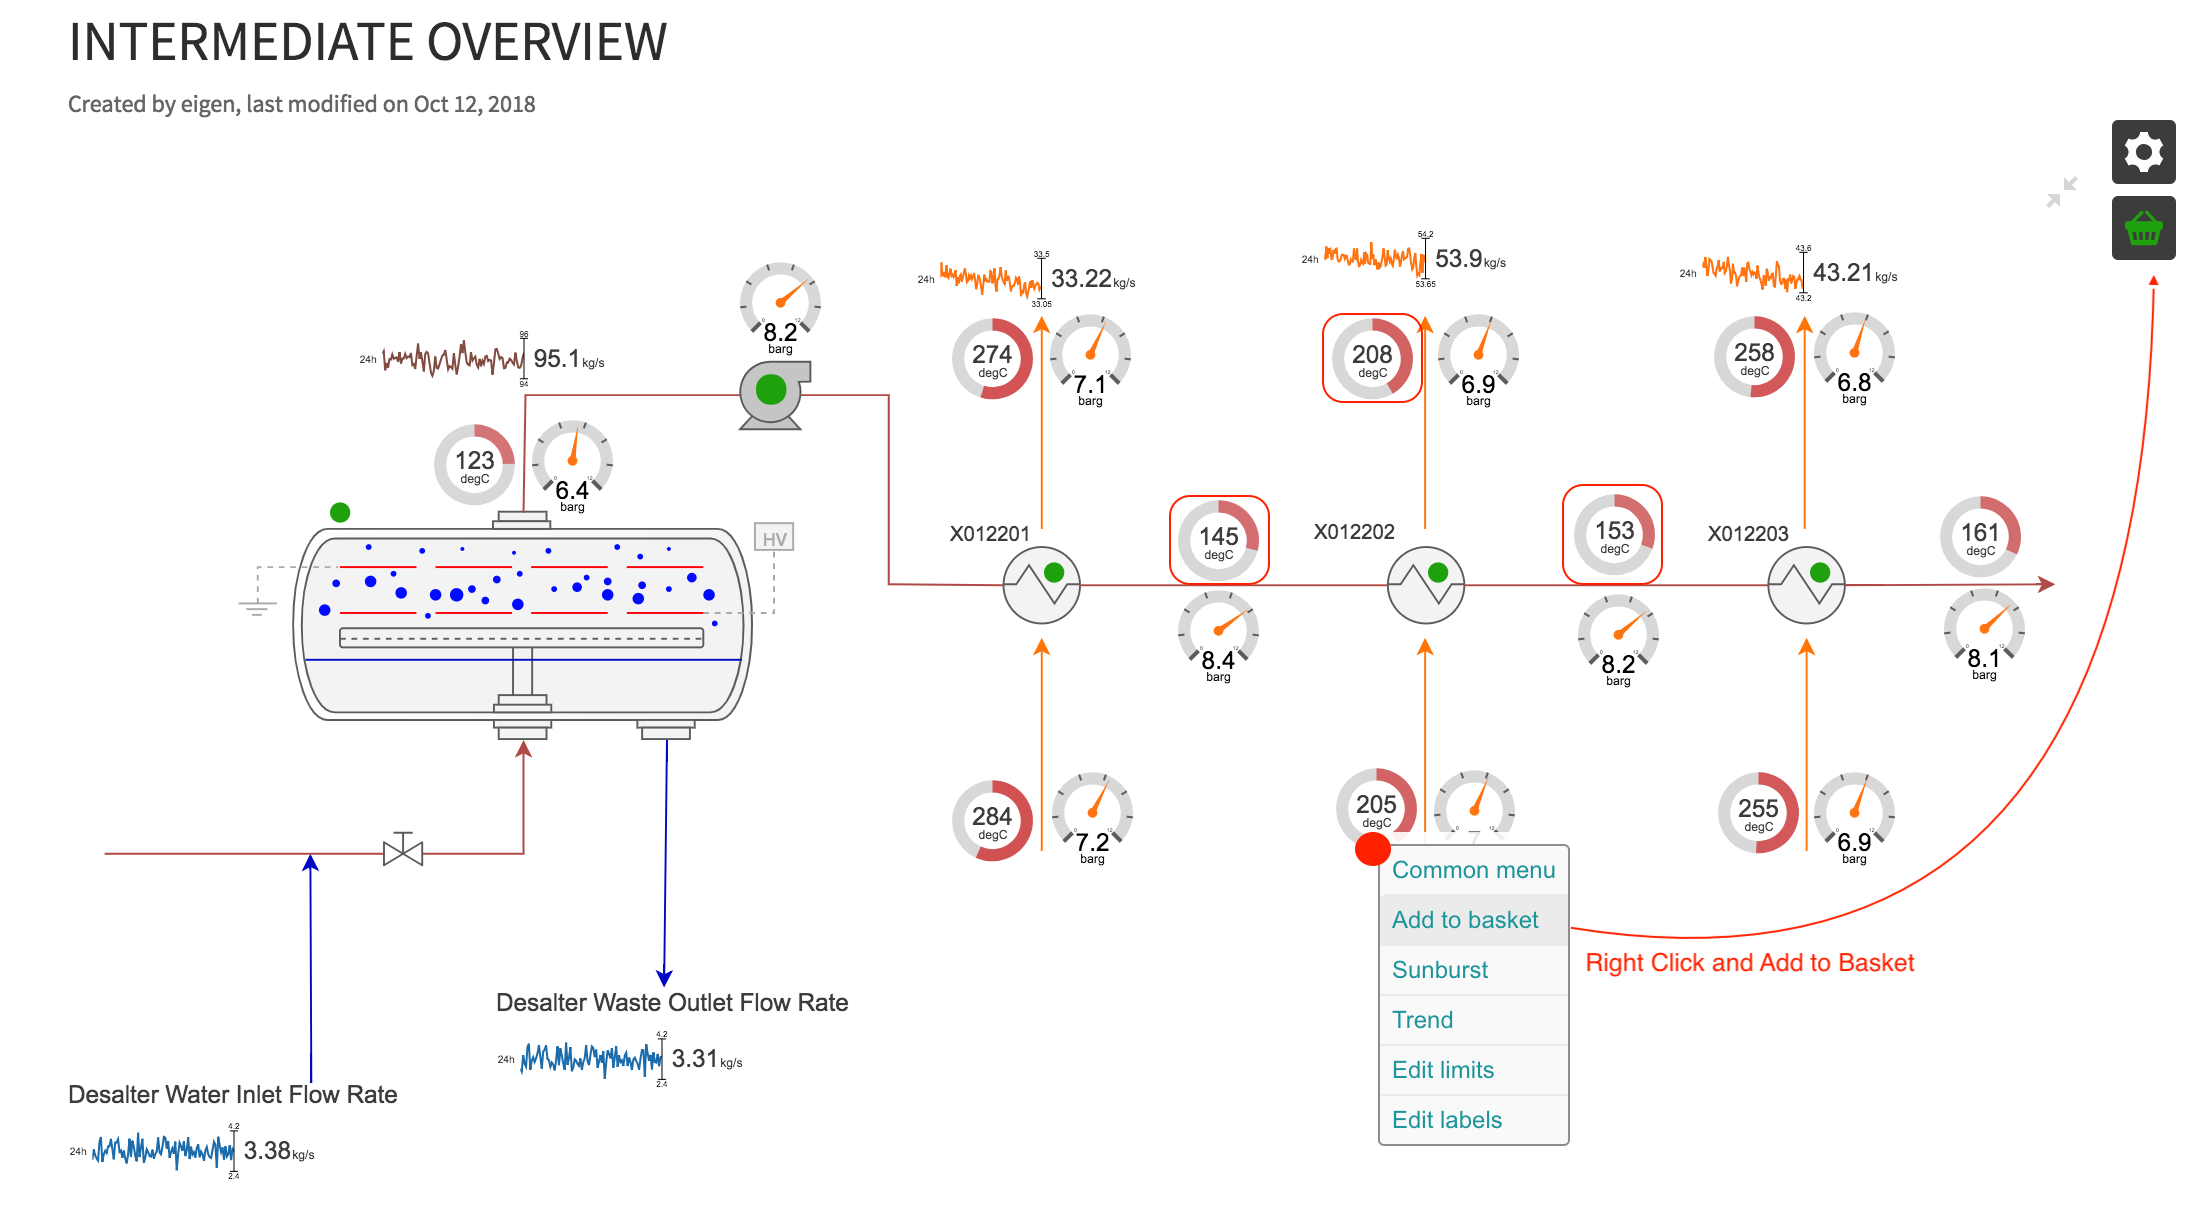
STEP 1 - ADD TAGS TO BASKET
First step is to go to the search macro or a page that contains the relevant tags.
- Right clicking or drag them into the basket.
- Remember you have the option saving the basket.
- Once you have added the tags you need in this calculation. We are ready to get started.
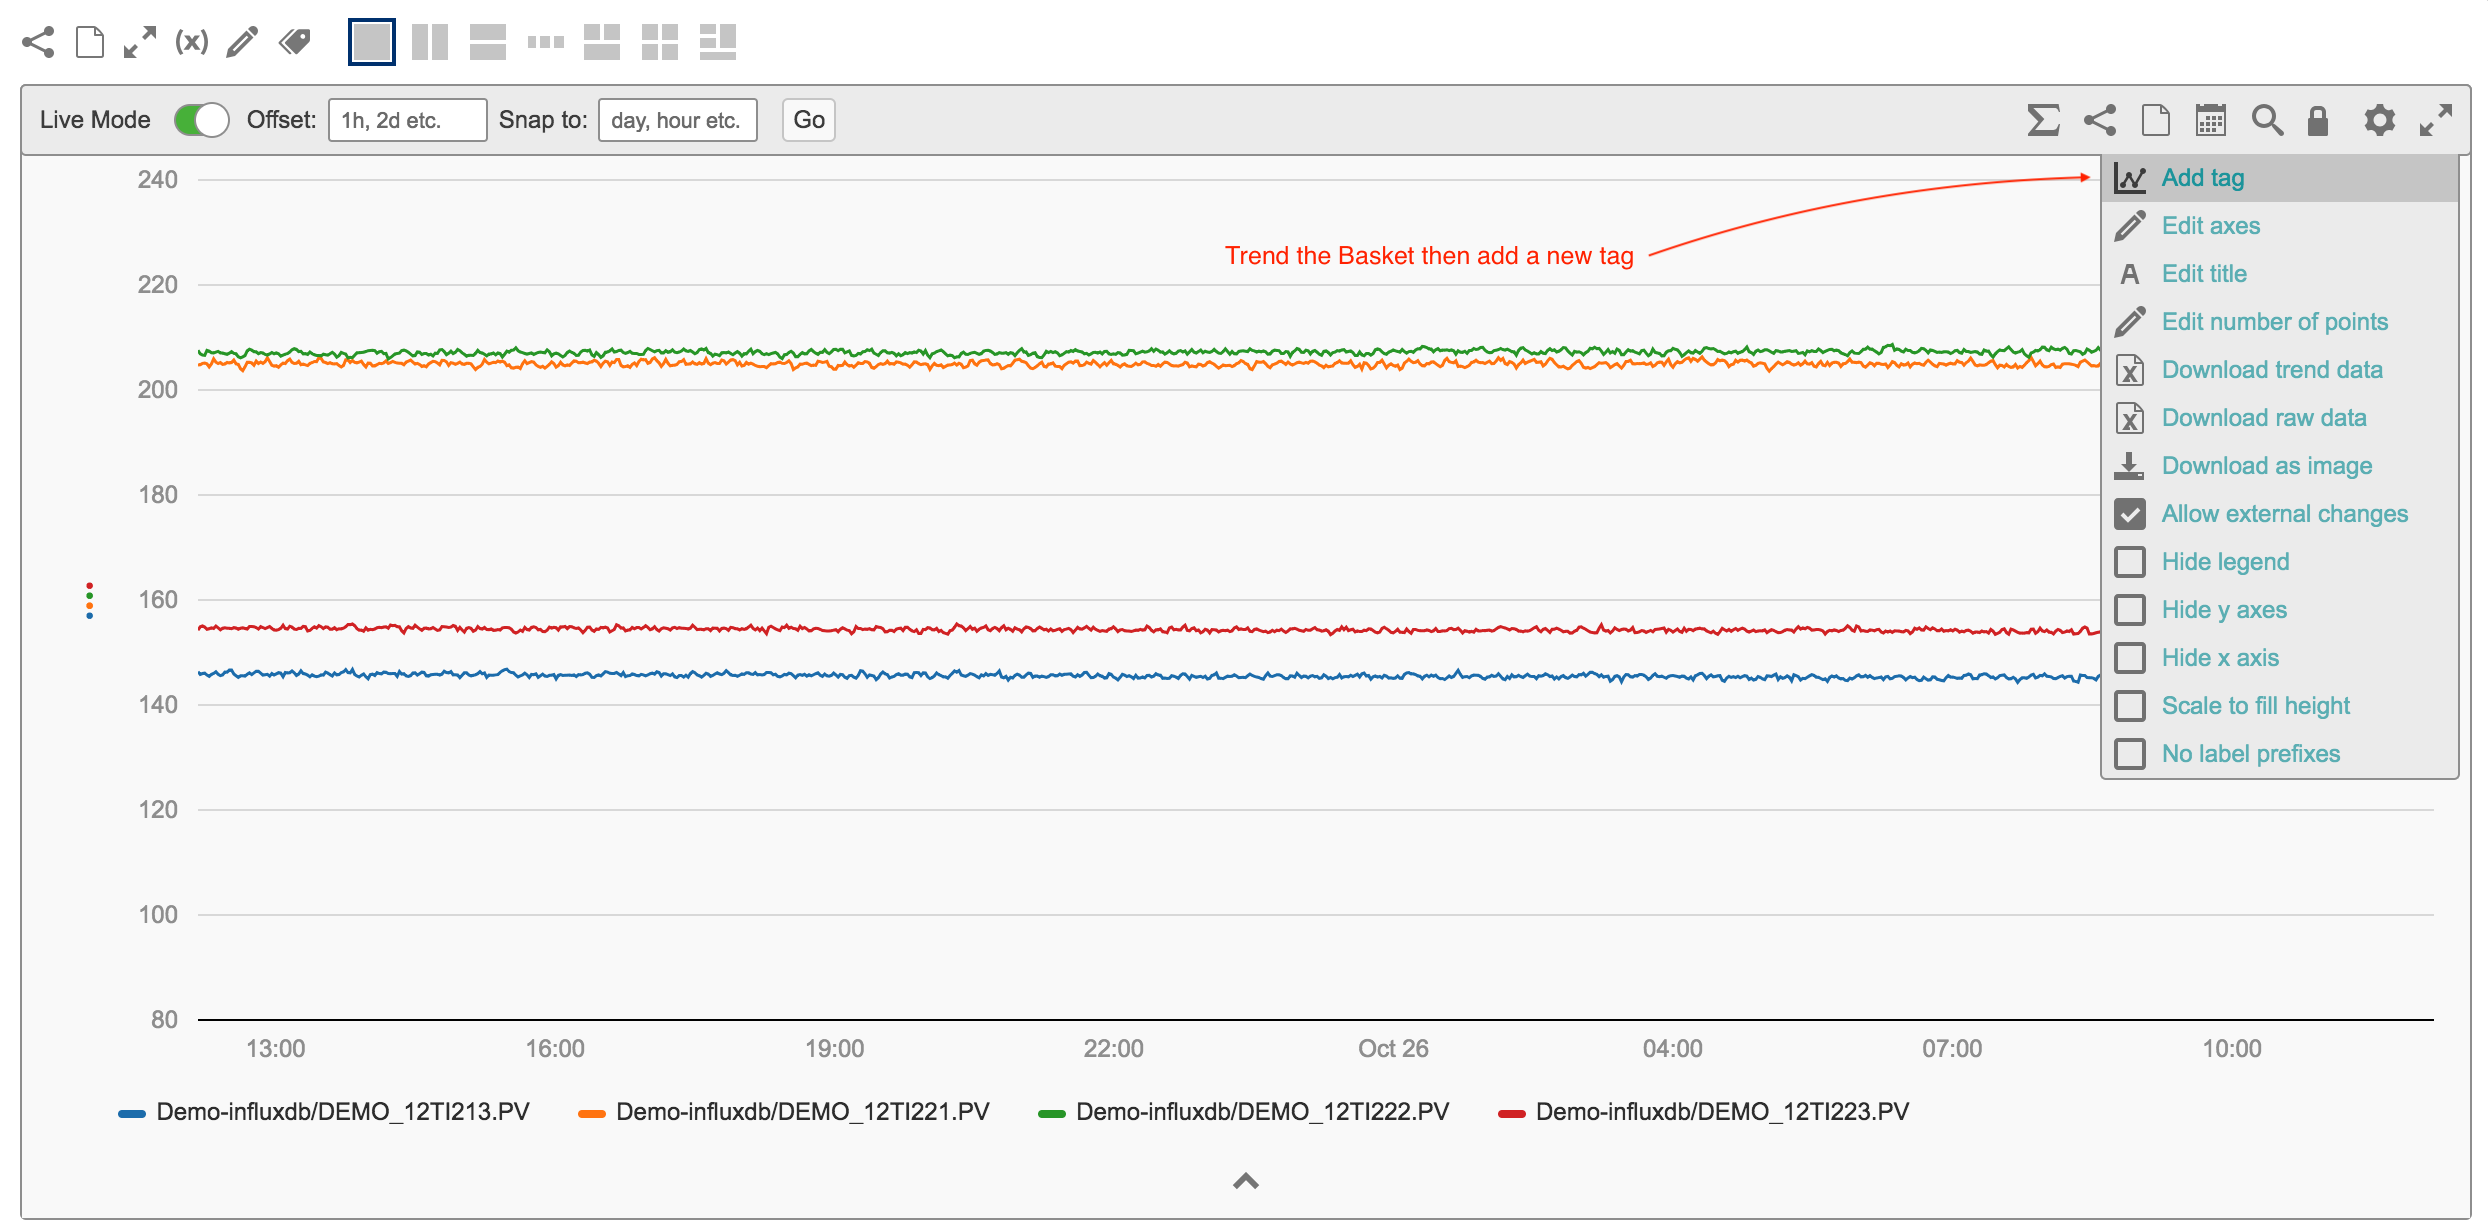
STEP 2 - TREND THE BASKET
- Trend the basket
- Were going to create out calculation on a new tag added to the trend window
- Select Add tag under the trend settings
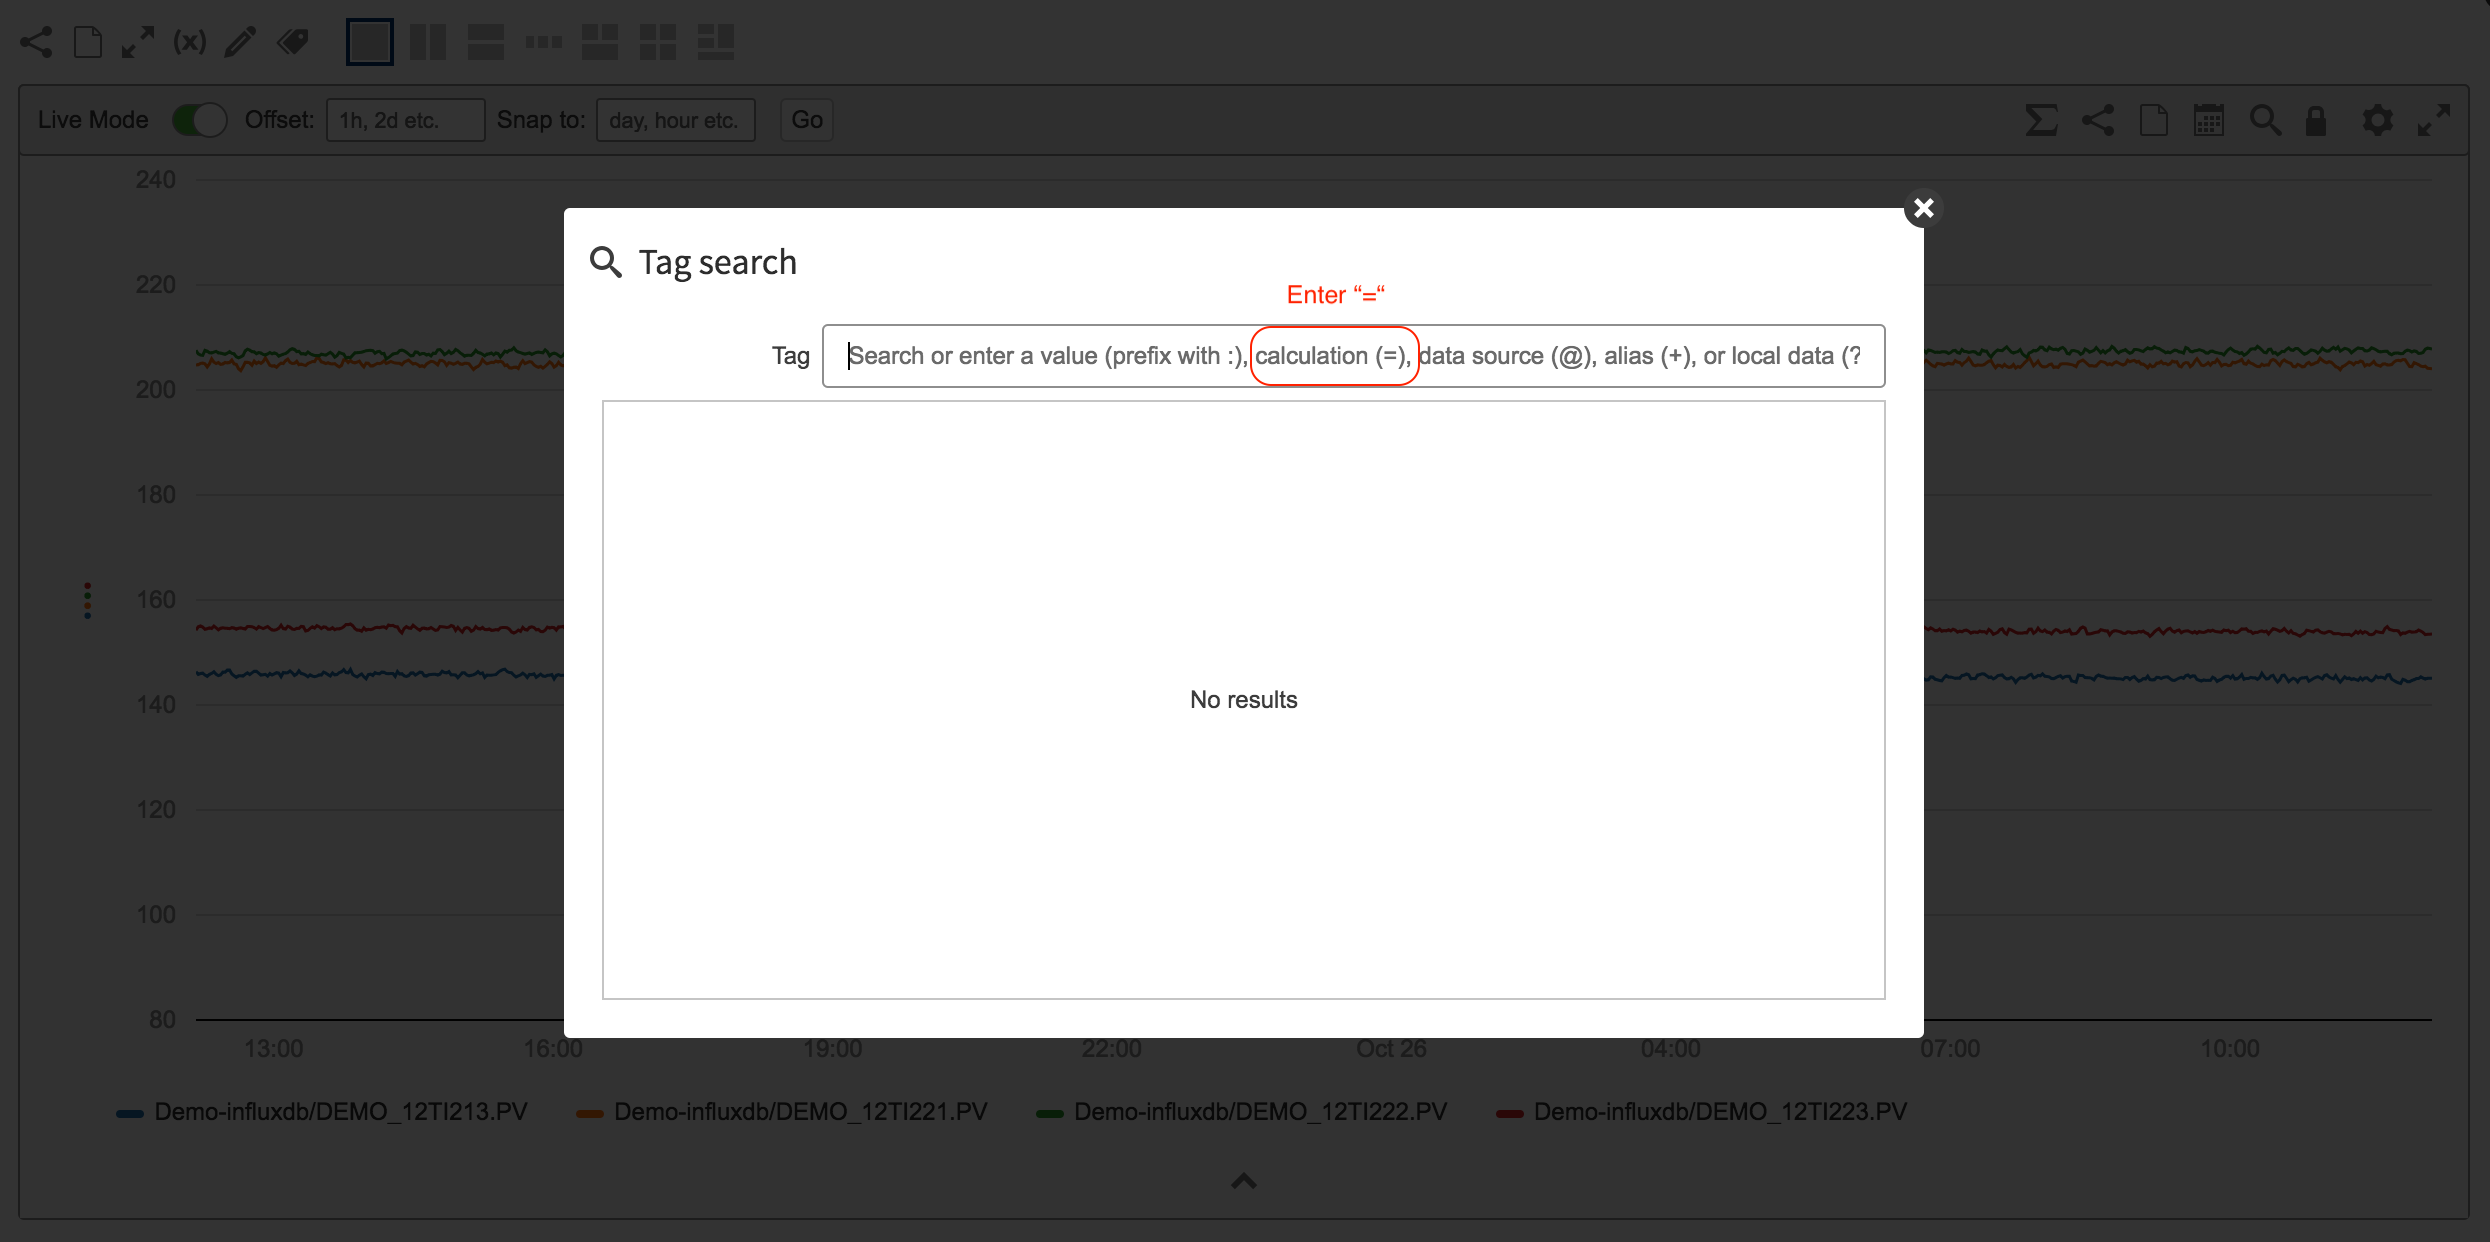
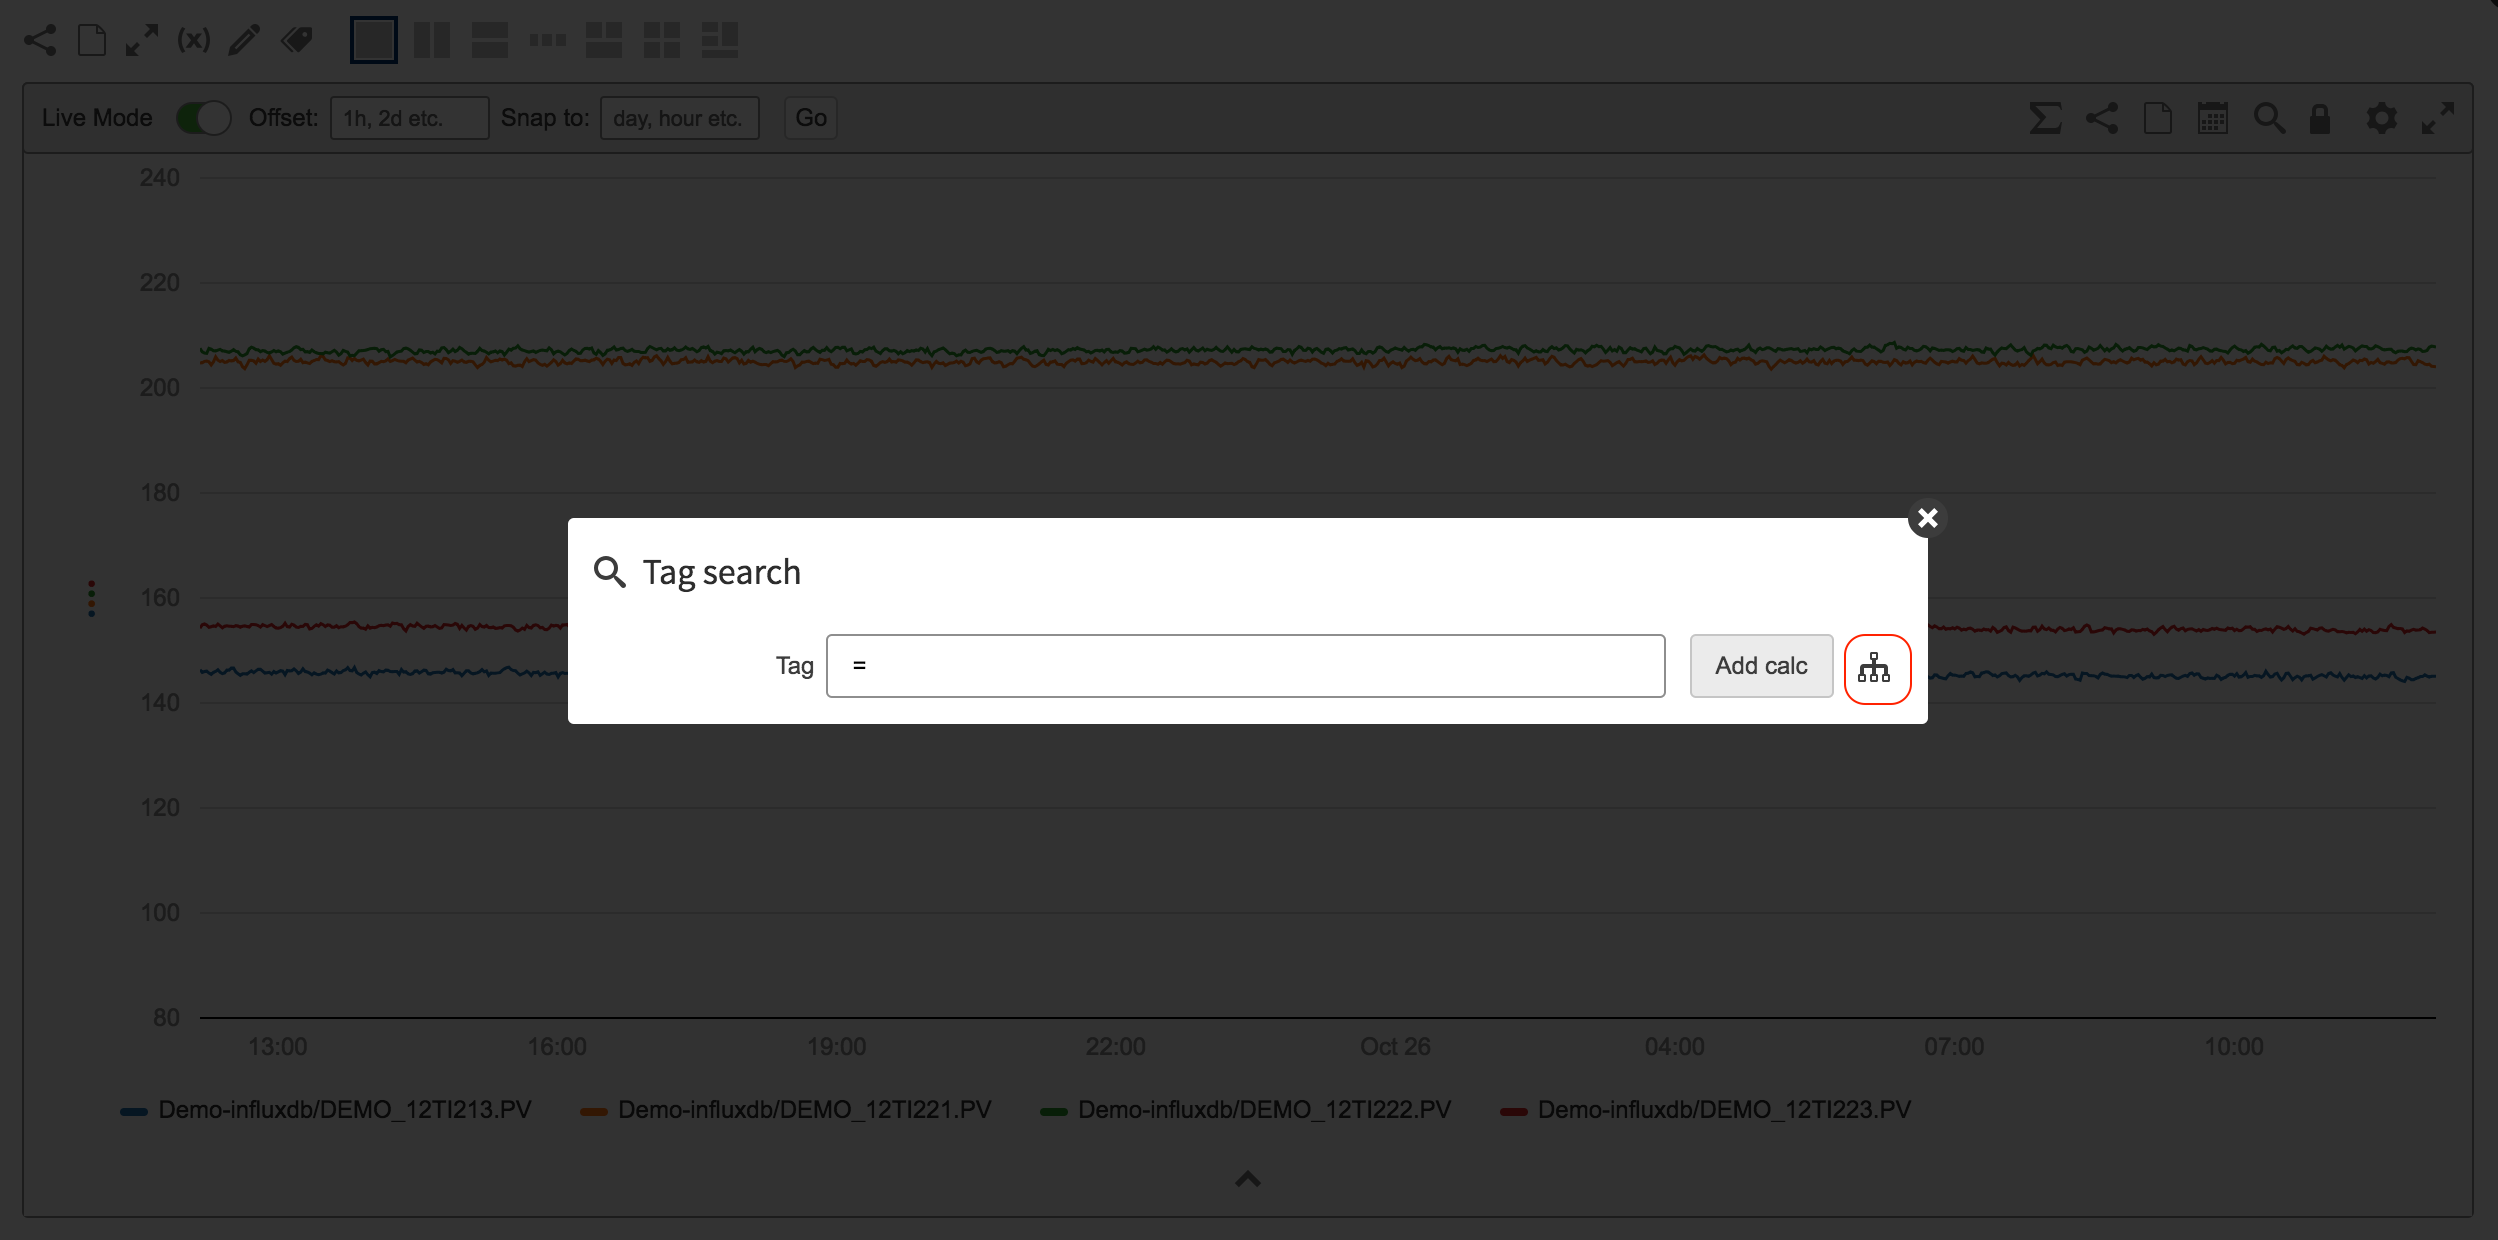
- Enter "=" into the search to activate a calculation
- Then open up the calculation builder
STEP 3 - BUILDING THE CALCULATION (2 Methods)
Two ways of building a multiple layer calculation.
1. Creating the Calculation Skeleton using the Eigen Calculation Builder then Dragging the relevant tags from the basket into the Calculation.
Step 1 - write out the calculation
We know the calculation we want to do is:
LMTD = ((Temp Hot Inlet - Temp Outlet Cold) - (Temp Outlet Hot - Temp Inlet Cold)) / LN ((Temp Hot Inlet - Temp Outlet Cold) - (Temp Outlet Hot - Temp Inlet Cold))
So we can start writing a few things in a calculation builder
- A division is written like - DIV(0,0)
- A subtraction is written like - SUB(0,0)
- A subtraction with in a subtraction is SUB(SUB(0,0),SUB(0,0))
- A LN statment is LN(0)
Now lets build the calculation
- Numerator = SUB(SUB(0,0),SUB(0,0))
- Denominator = LN(SUB(SUB(0,0),SUB(0,0)))
- Wrap it in a Divide we get
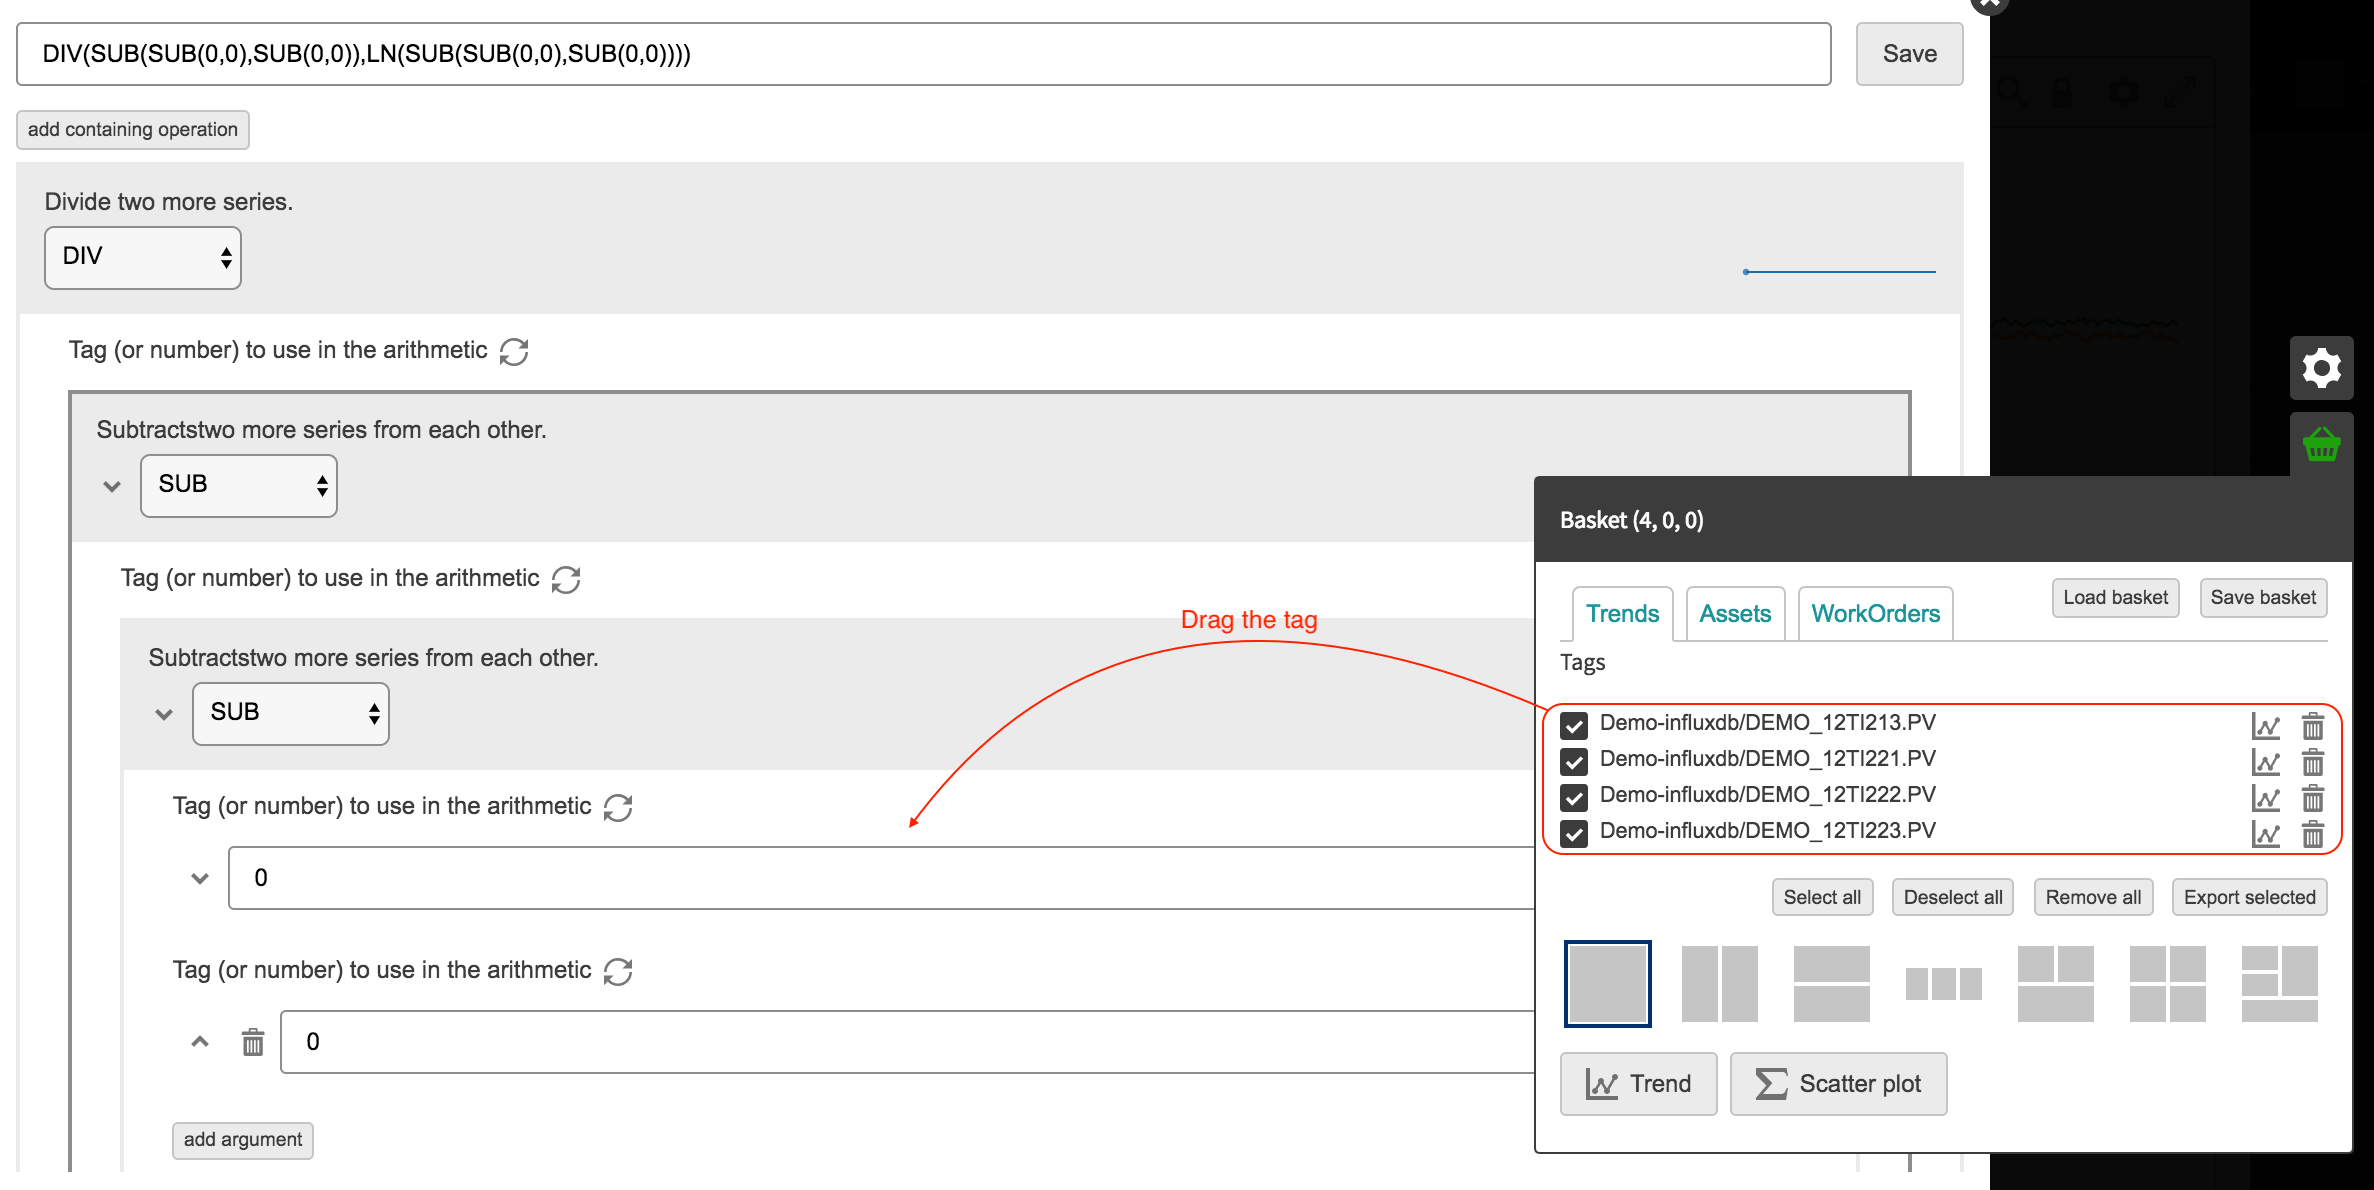
- DIV(SUB(SUB(0,0),SUB(0,0)),LN(SUB(SUB(0,0),SUB(0,0)))
Step 2 - Populate are calculation builder with the tags from the basket
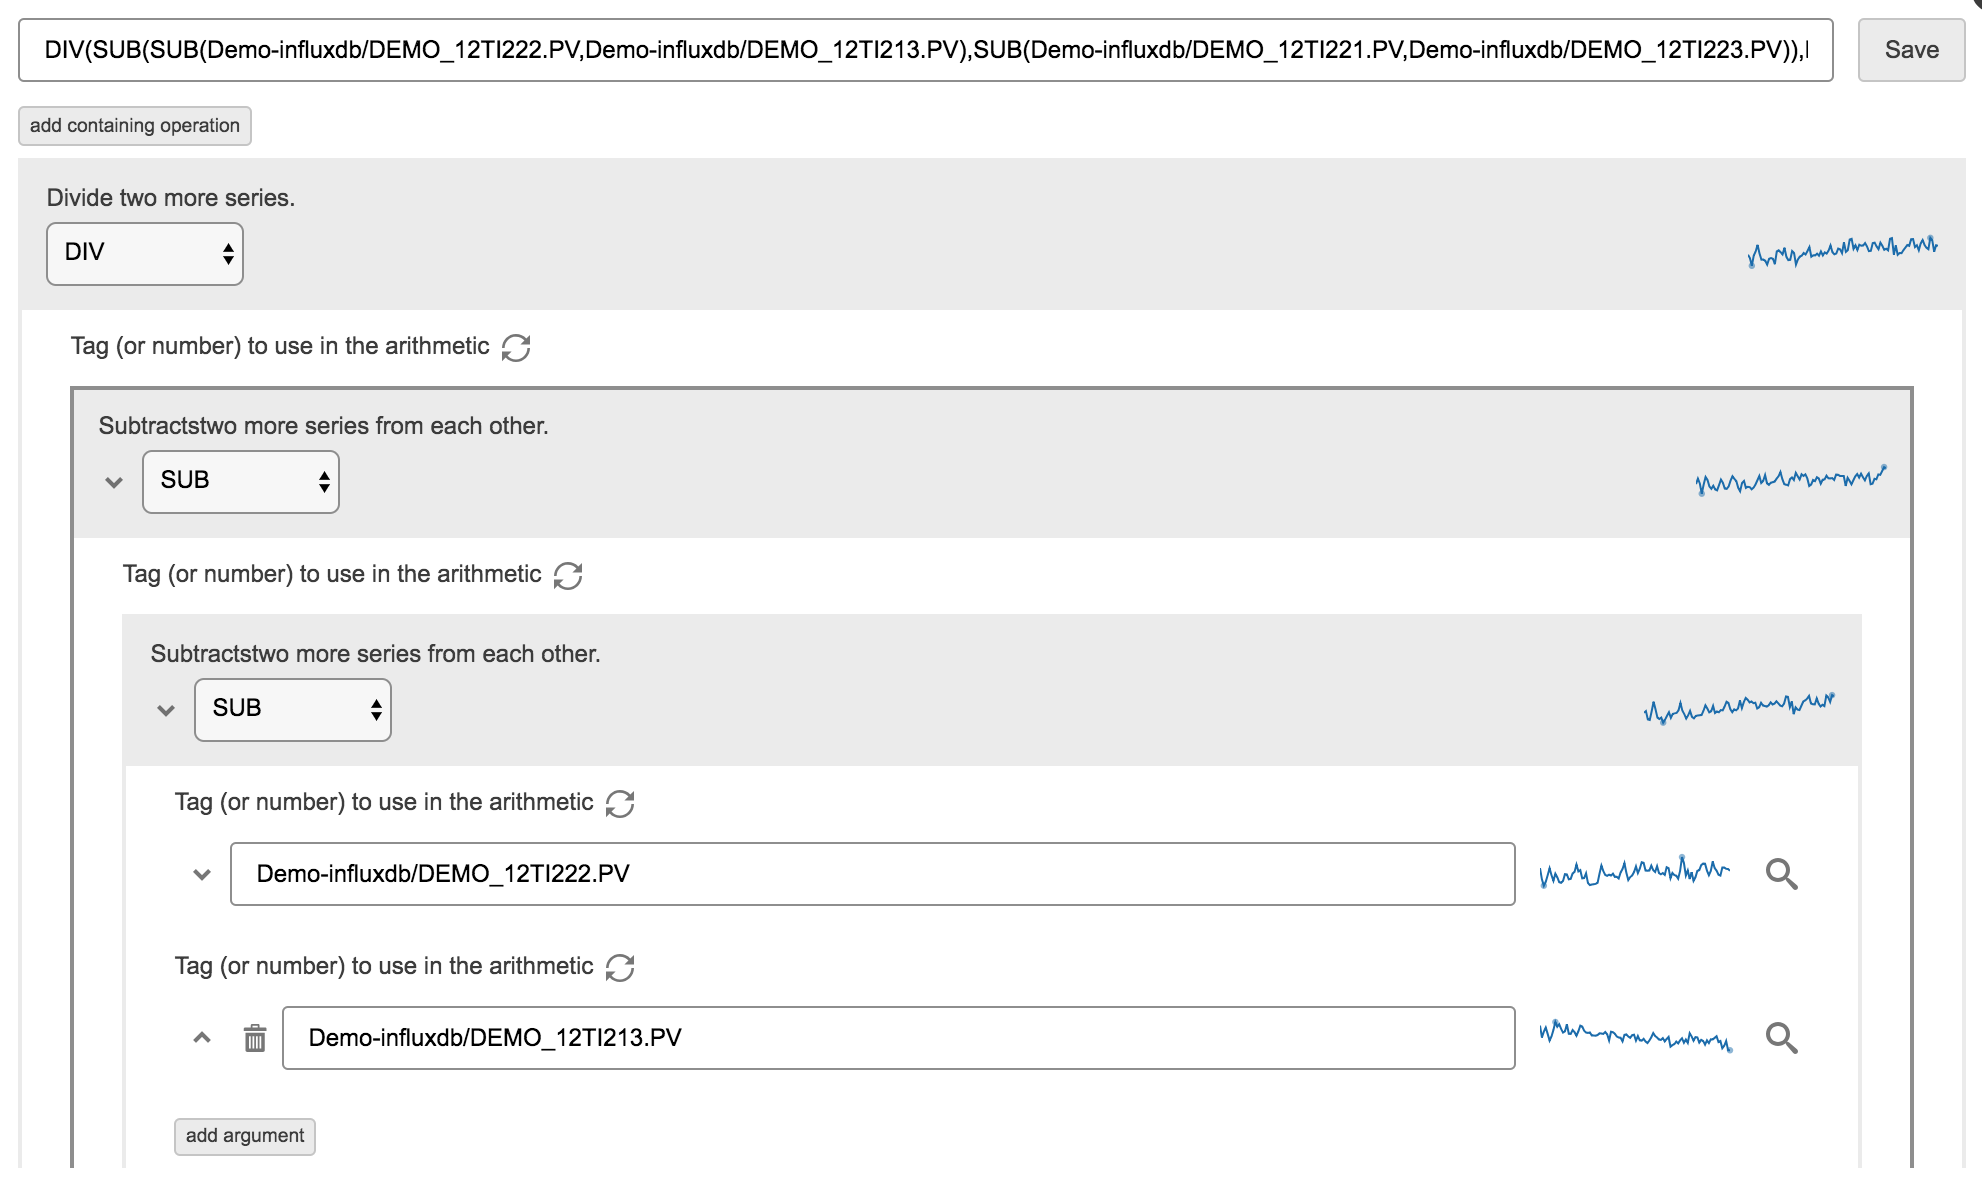
- Drag a tag from the basket into a spot.
NOTE - The trends at the end of each tag indicate it. If a tag is input wrongly this will not display. It will also indicate if your calculation is invalid.
2. Build the calculation in layers adding each layer into the basket.
DIV(SUB(SUB(0,0),SUB(0,0)),LN(SUB(SUB(0,0),SUB(0,0))))
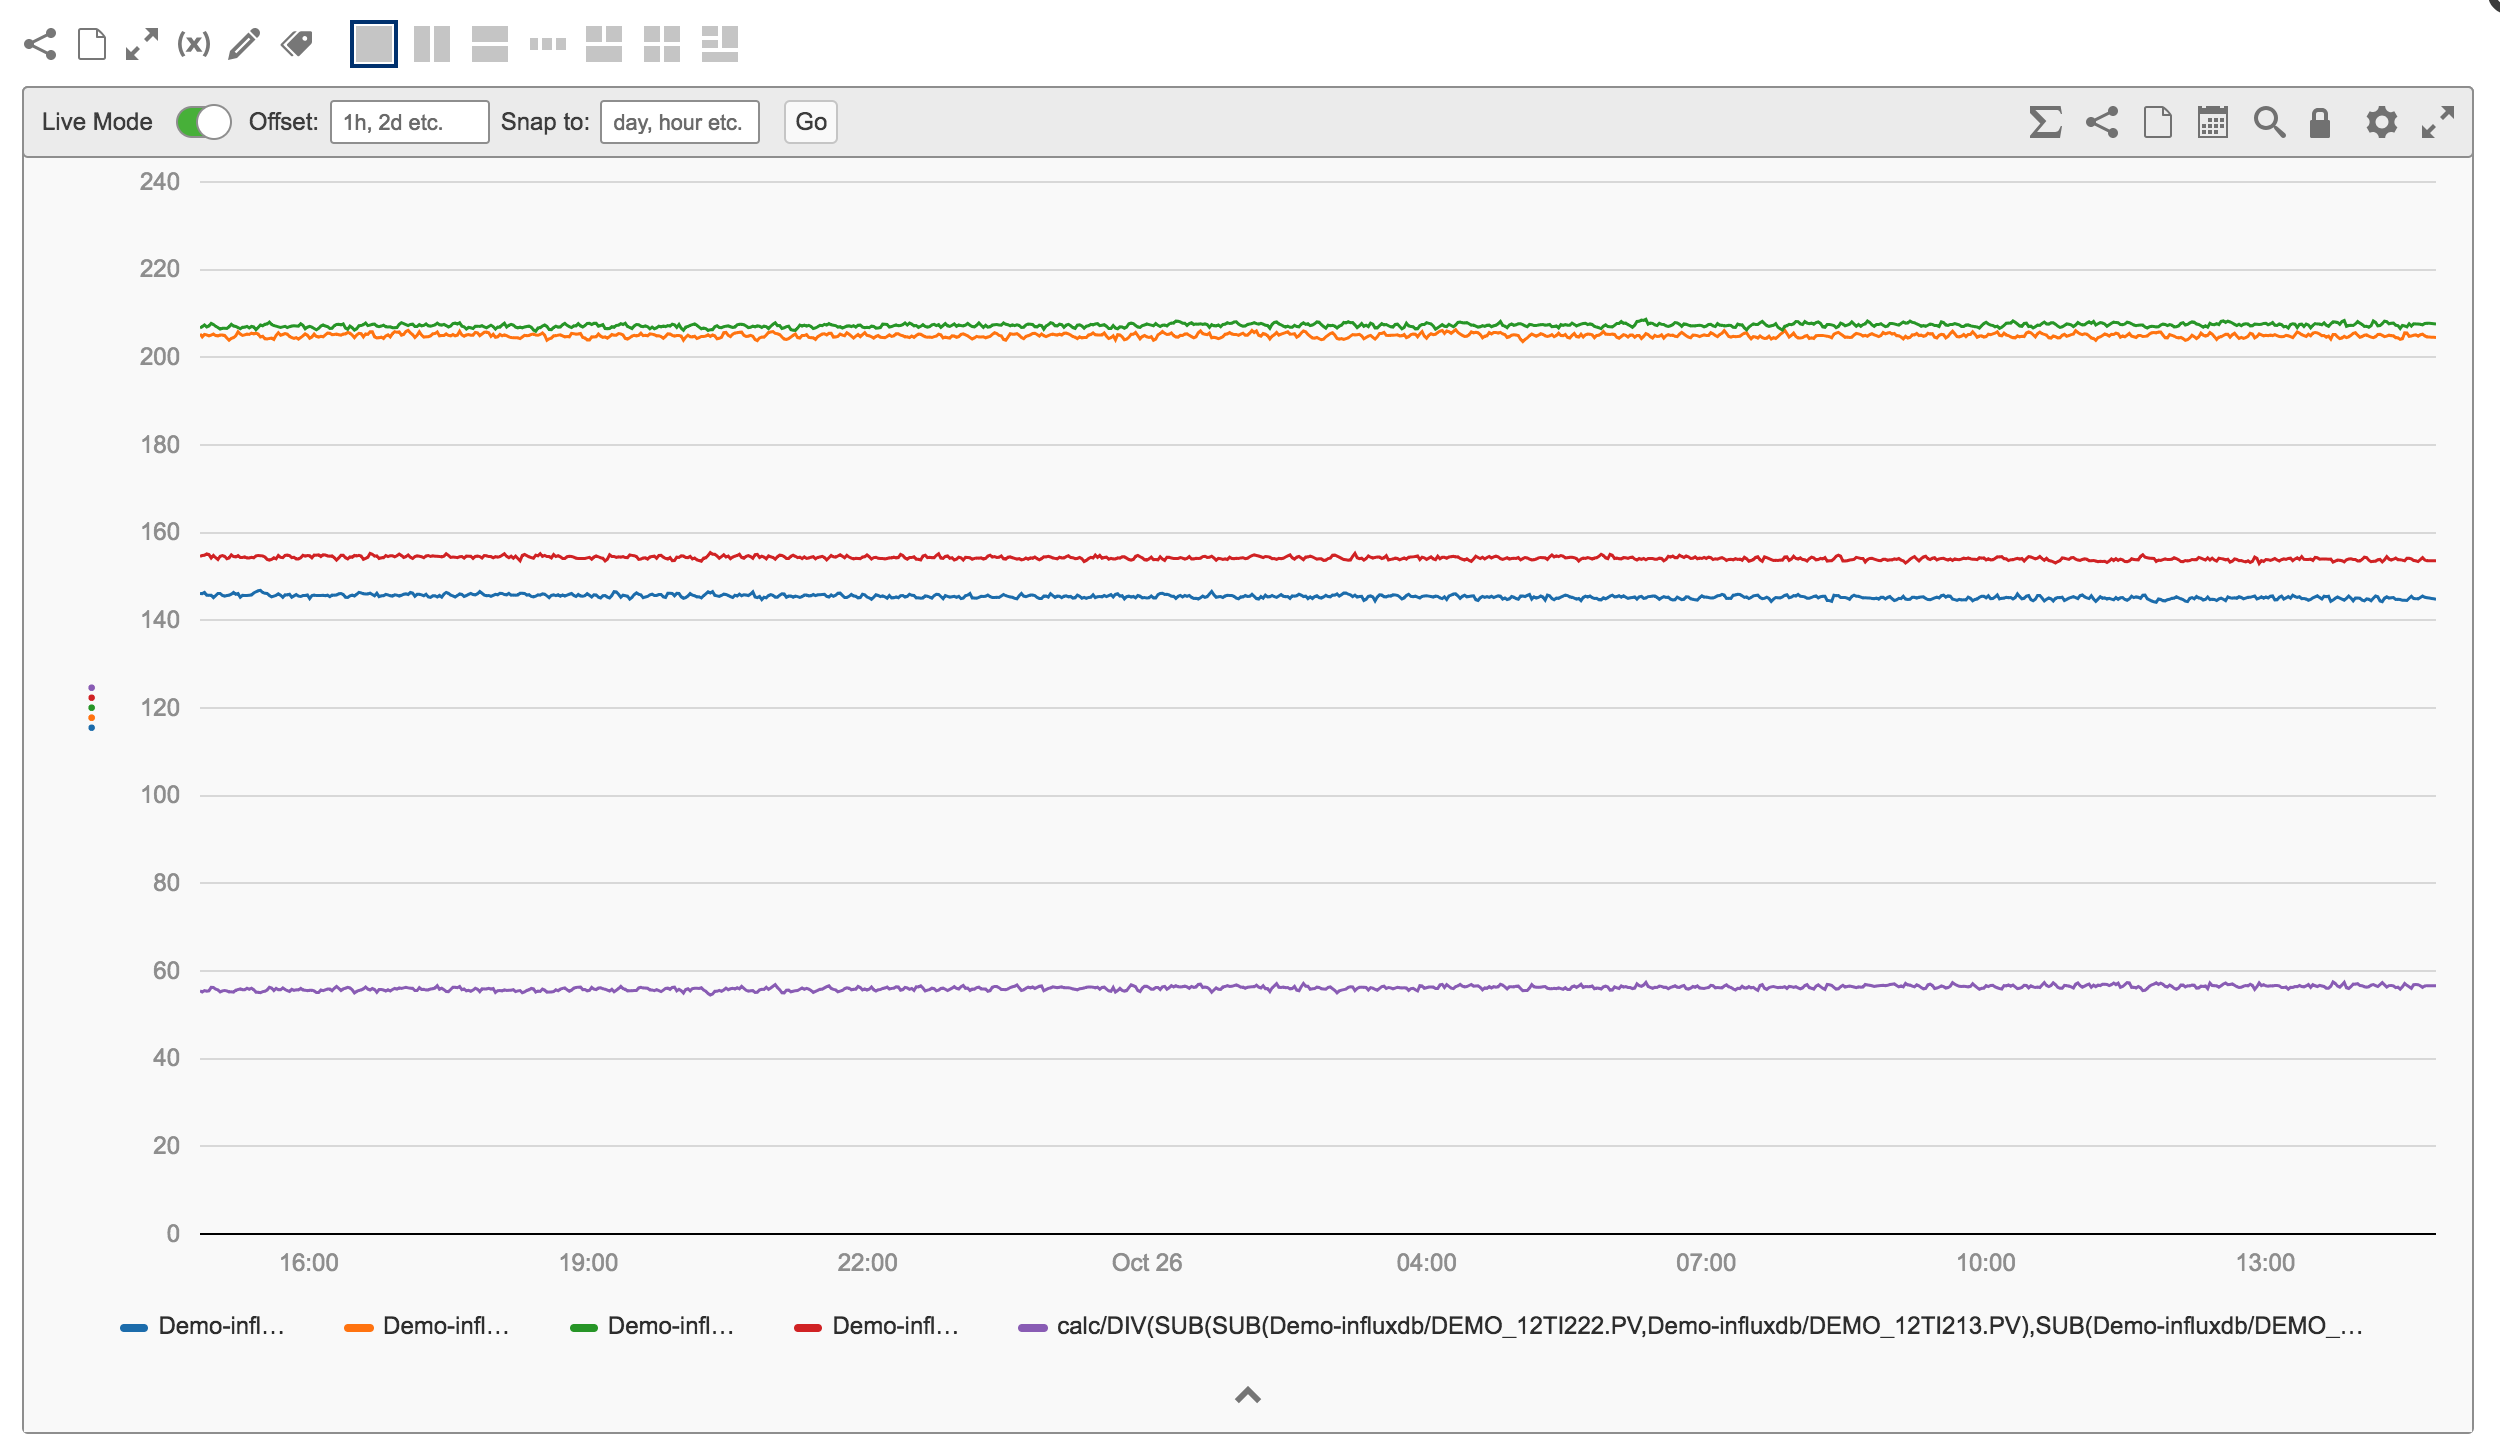
STEP 4 - USING YOUR CALCULATION
Once you have created your calculation and its displaying on the trend
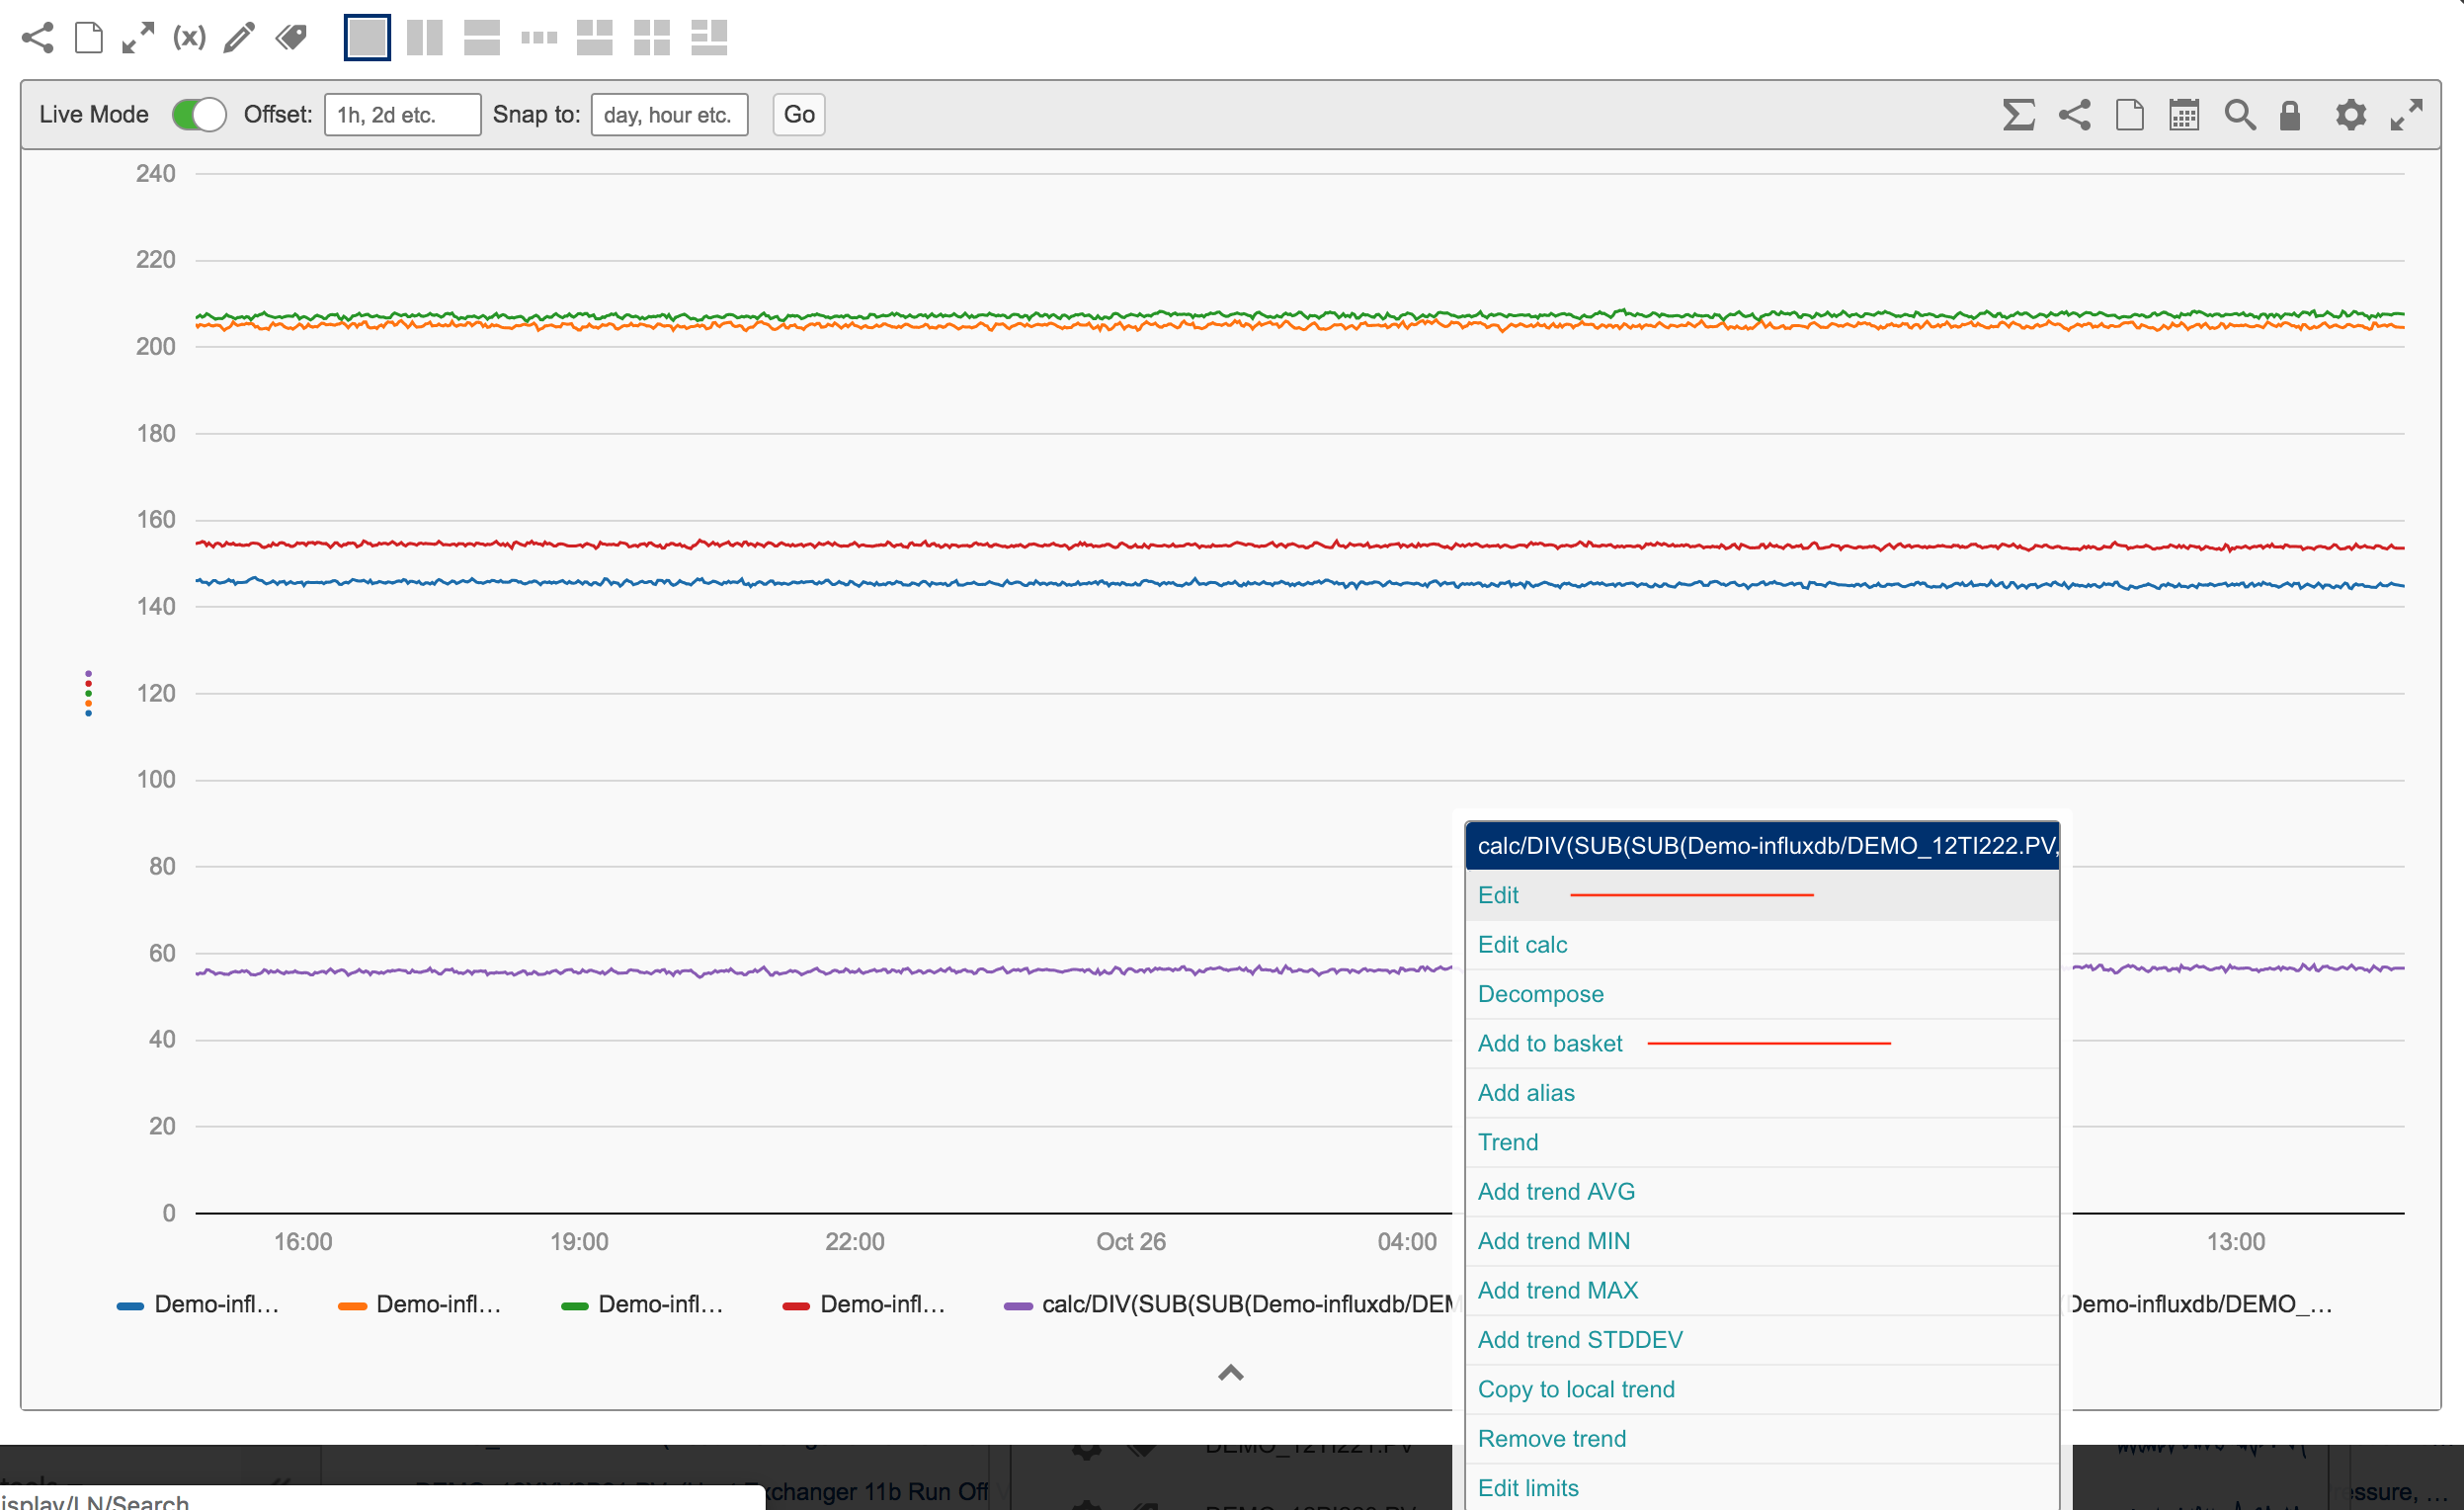
- You need to change the name to make it easier to visualise - optional
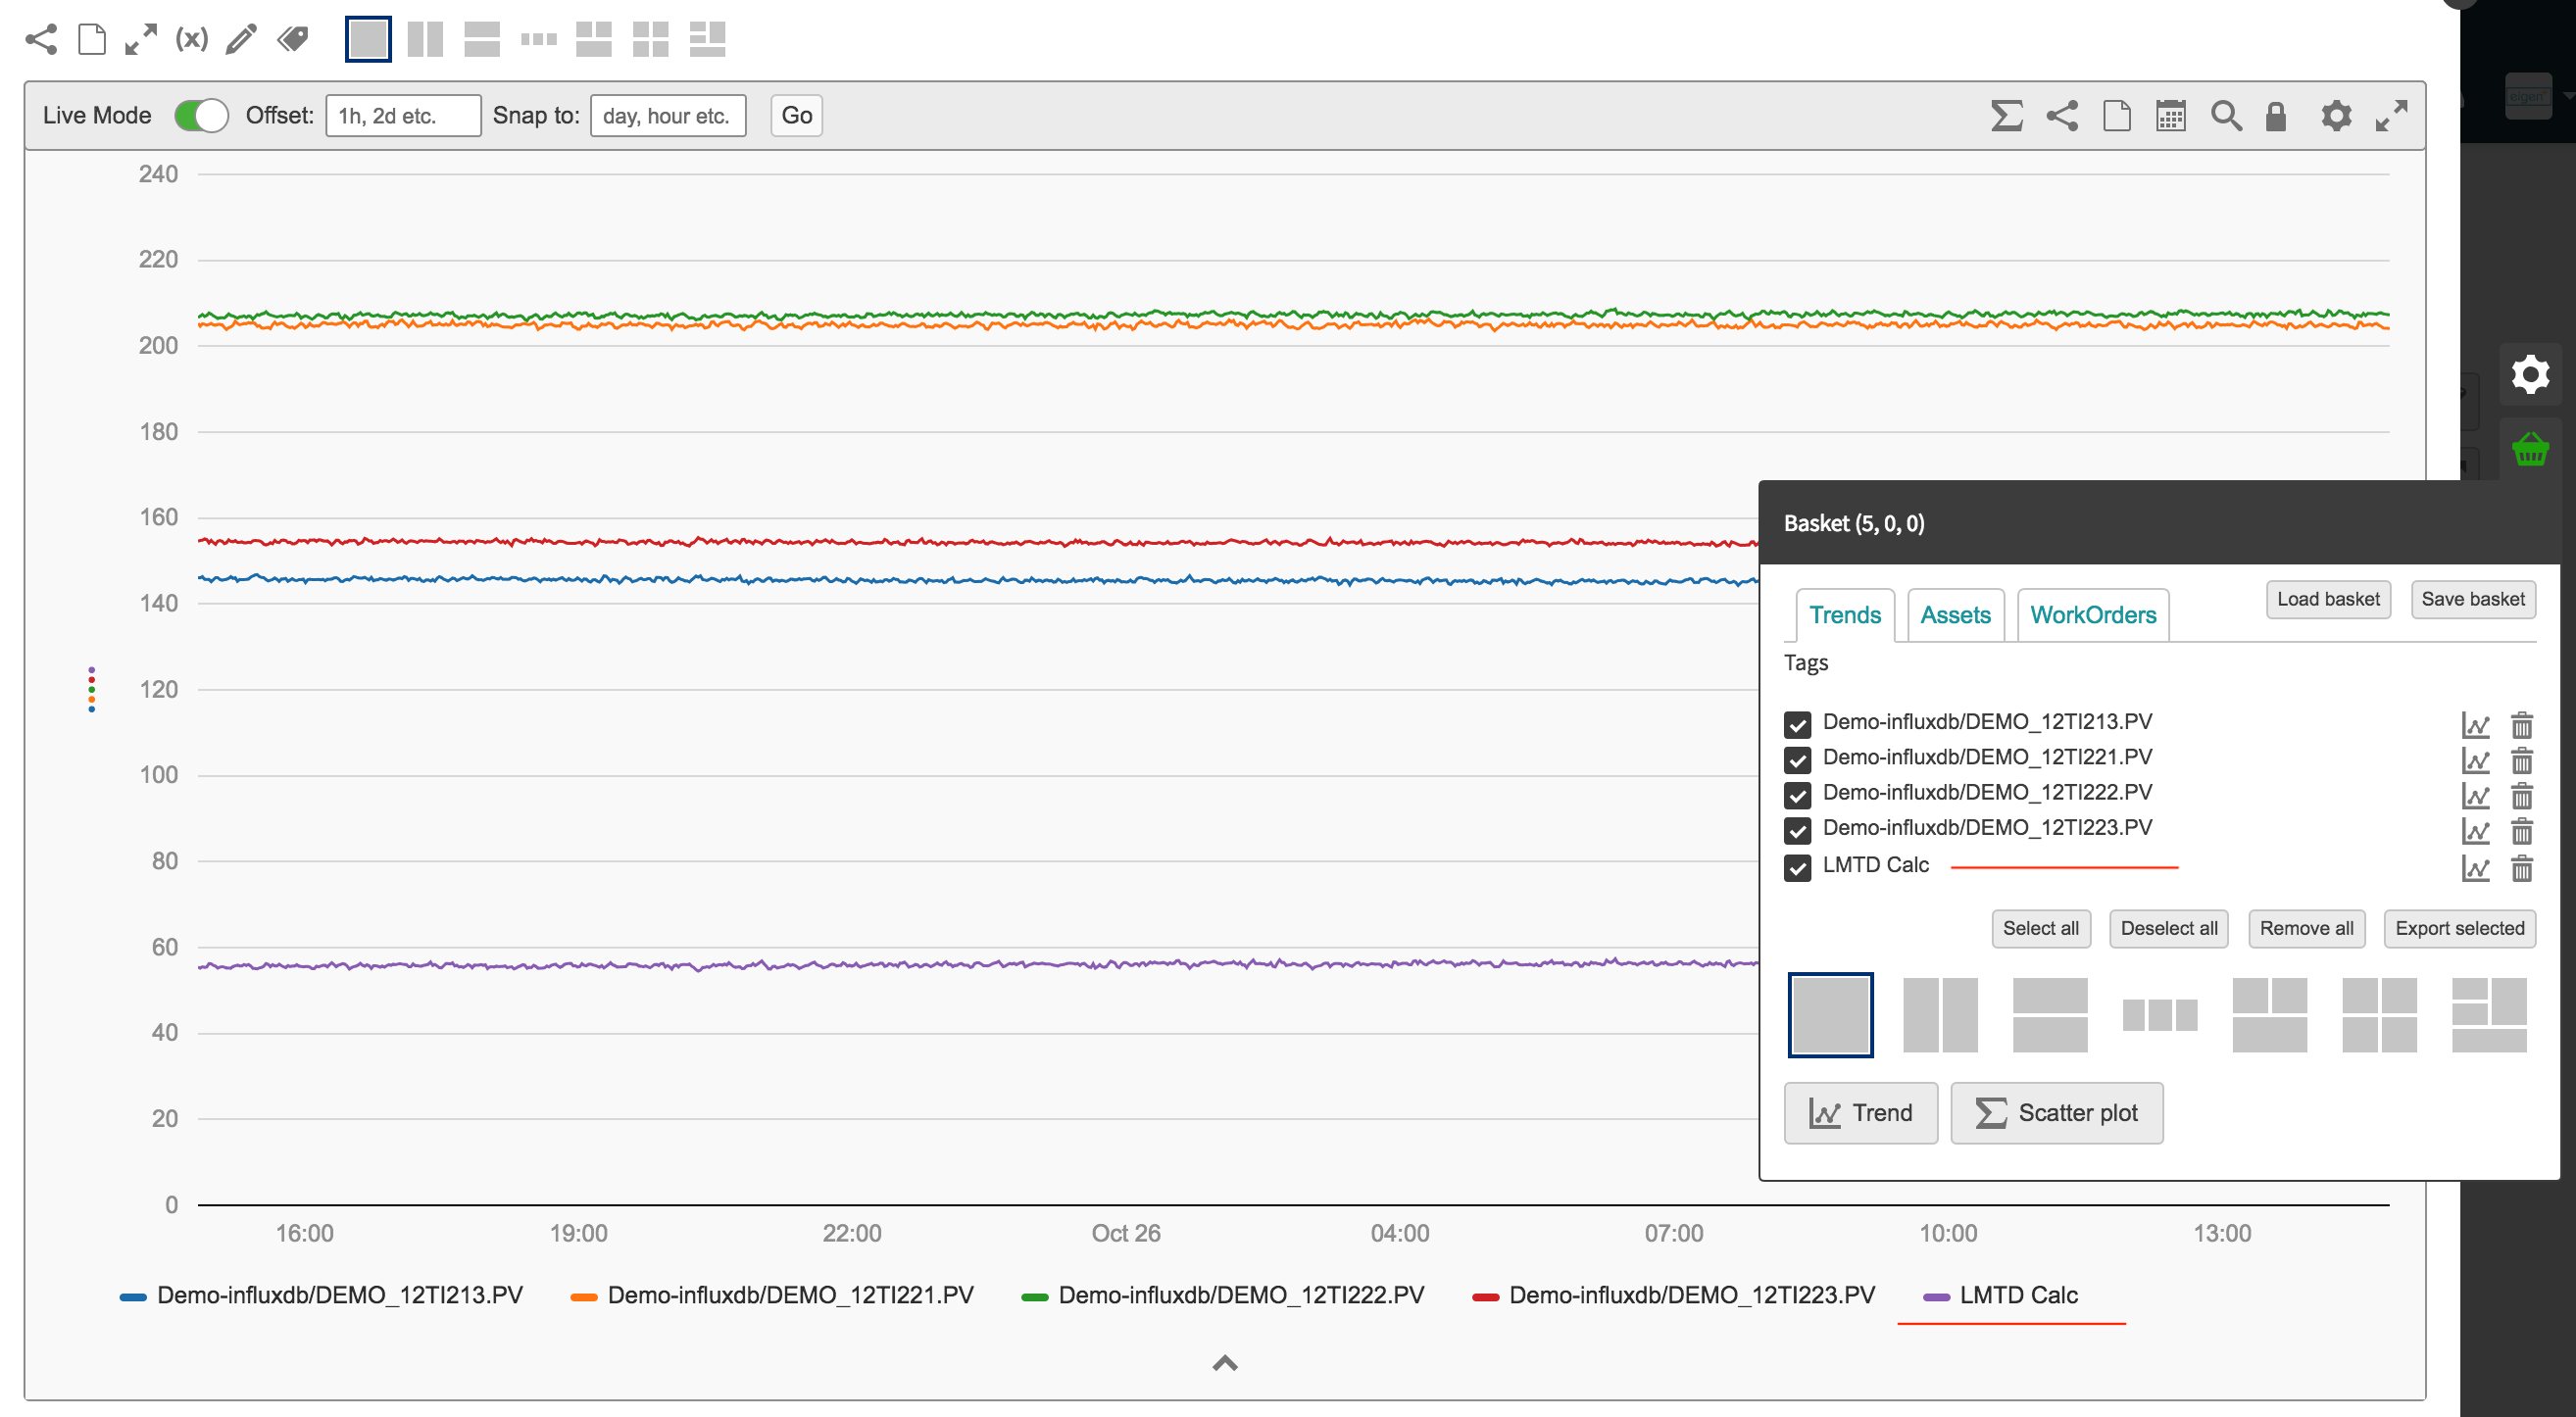
- Then add this calculation to the basket.
- Once your calculation is in the basket you can drag and drop it anywhere you want it from the basket
.
Save the Basket. Or copy the calculation into a KPI macro and save that so you don't loose your work. If working in a KPI make sure to save it