Page Tree
| Page Tree |
|---|
| root | Eigen Ingenuity Components |
|---|
|
Overview
Displays key performance indicators in a variety ways. It allows users to create displays containing simple numbers to a complex table. It has various charting, text, graphics and numerical views that can be combined to create a single view of numerous KPIs. Extremely useful when creating dashboards enabling users to see at a single glance what's happening.
How to use the KPI. Using the KPI is very strait forward. There are several options located in the top bar which we will go over
...
...
...
...
-first youll need to take hte KPI out of seemless mode if it is not all ready buy clicking the two arrows in cirled in red
-Then toggel edit mode on
 Image Removed
...
customising it.
There a many different types of content you can add to to your KPI
- Datatag
- Asset
- Text
- Scale
- Data table
- Chart
- New Channel
Examples
 Image Added Image Added
|
 Image Added Image Added
| Edit Mode Switch - Toggle the edit button to edit the contents of your KPI
|
 Image Added Image Added
| Live mode Switch - Toggle between live view and historic view. When entering historic view (live mode off) the latest value will be shown indefinitely
|
 Image Added Image Added
| Offset Live Mode ON - Offset mode when live mode is activated will offset the live data in the past by a set period. For example, -5h would offset the data display to 5 hours ago
|
 Image Added Image Added
| Offset Live Mode OFF - Offset mode when live mode is deactivated. Will anchor the time to a set time frame
|
 Image Added Image Added
| Save and Revert - After you have made changes to a KPI, you will have the option to save it or revert to the last saved version of this KPI
| Info |
|---|
Note - If you're not logged in or don't have permissions to change the content you will still able to change the KPI, but won't be able to save it and will loose your work |
|
 Image Added Image Added
| Share Page |
 Image Added Image Added
| Create Page |
 Image Added Image Added
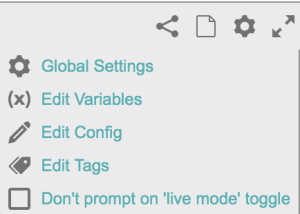 Image Added Image Added | Global setting - First row Heading makes the first row bold text
- Hide grid lines hides the grid lines
- padding allows you define the margins of each KPI element
- Reset weights will brings the weights of KPI elements back to 1. (ie if one is merged into 3 cells goes to 1)
- Refresh Rate is how often the KPI updates its data
|
Once edit mode is on you have two ways to configure |
...
...
- Grid Format
- Open canves
select the setting cog
 Image Removed
which will bring up this menu
 Image Removed
Select Global Settings
environment: 1. Grid Format 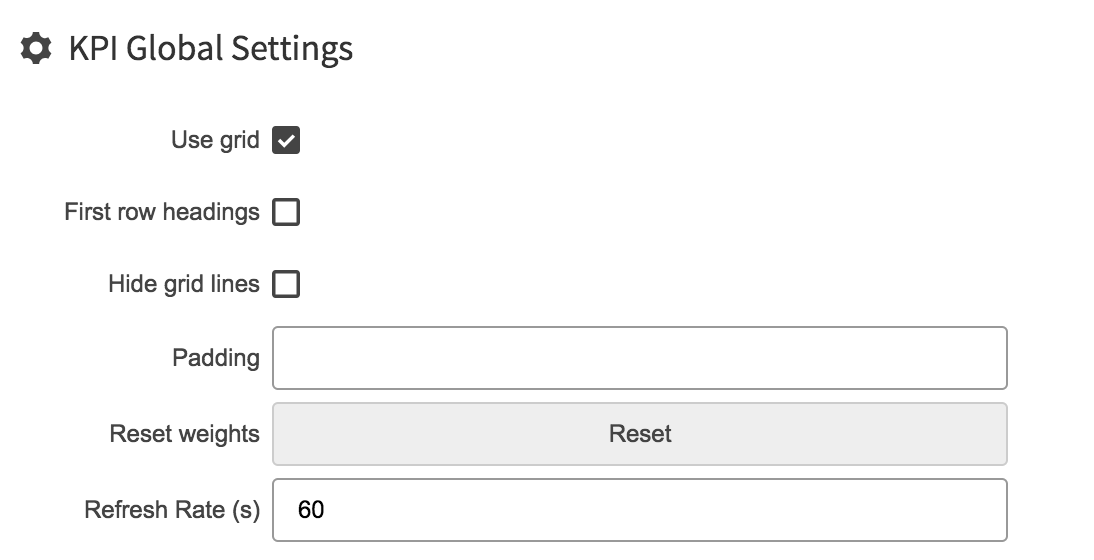 Image Added Image Added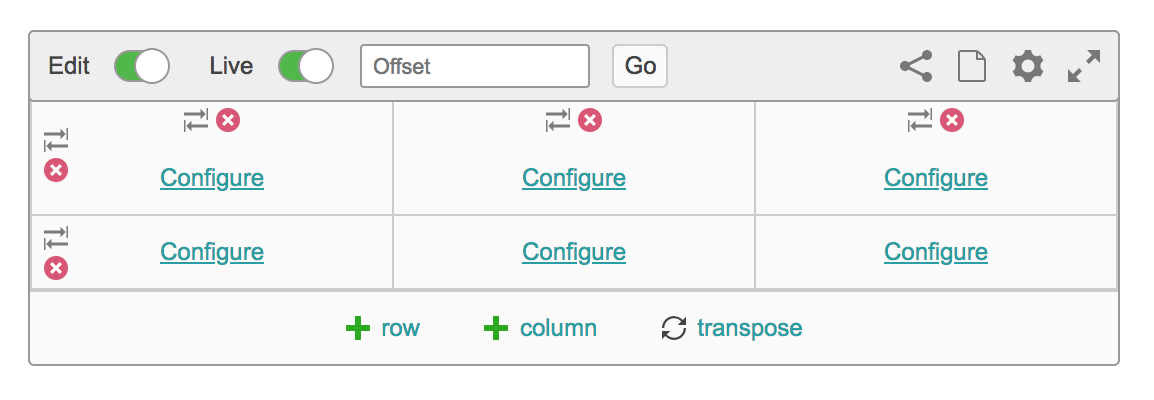 Image Added Image Added
2. No Grid - If you untick Use grid you can freely place and move around your KPI objects
- Use add button to add elements to your KPI
- With the no grid format you can import images and back ground images (e.g. svg diagrams, technical drawings etc) to go behind it and place your data on top of it like so
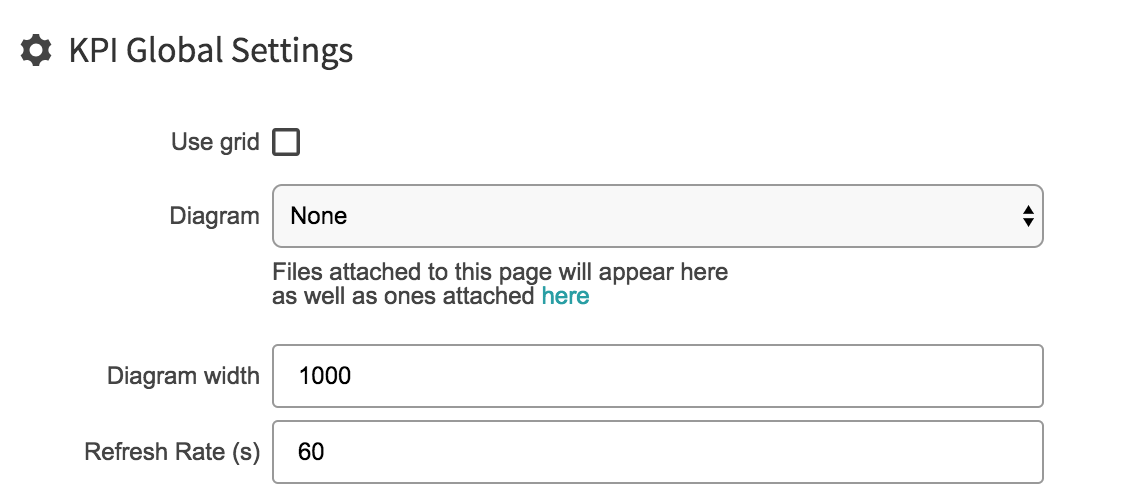 Image Added Image Added
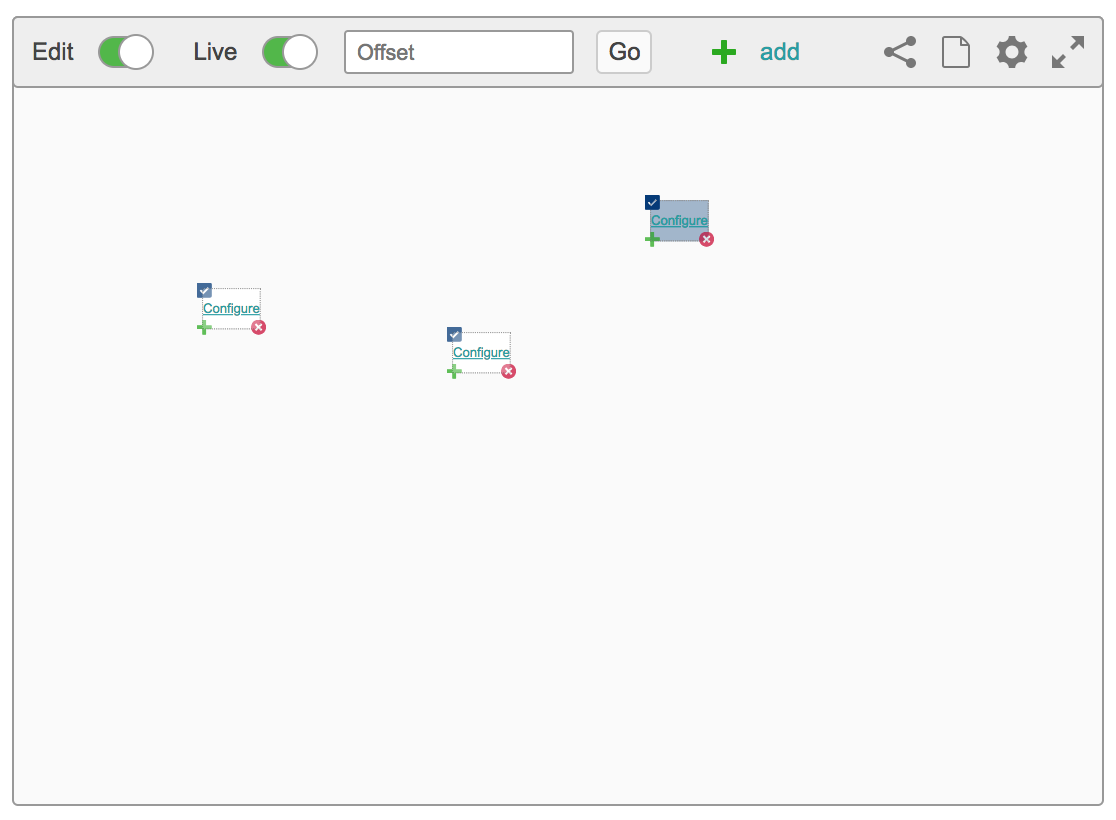 Image Added Image Added
|
Edit Variables Variables in a KPI allow a user to enter a value in one place and have it used by all the KPIs in the frame KPI Variables |
Edit Config This were you can view and edit the configuration code of the KPI. | Tip |
|---|
- You can copy this code from one KPI and paste into to another to easily copy a whole KPI
- Copy and paste into a text editor to perform search and replace and make changes
|
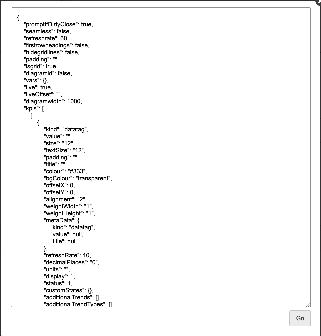 Image Added Image Added
|
Edit Tags |
| Don't Prompt on 'Live Mode' toggle |
 Image Added Image Added
| Seamless Mode - This Takes away the Tools menu from your KPI and just displays the content on the screen
|
 Image Added Image Added
| Delete Icon |
 Image Added Image Added
| Move Column or Row - This button is located at the top of column or side of a row
- Click and hold then drag onto another start of a column or row to swap the row or column
|
 Image Added Image Added
| Transpose - Transpose flips the Rows with the respected Columns
- Transpose of a Matrix - A matrix which is formed by turning all the rows of a given matrix into columns and vice-versa
|
 Image Added Image Added
| Column - Adds another column to you KPI macro when grid is enables under Global settings
|
 Image Added Image Added
| Row - Adds another Row to you KPI macro when grid is enables under Global settings
|
 Image Added Image Added
| Configure - KPI Component Configuration
- This is where you come to configure content with in your KPI
- Table cells can be dragged around within the widget to swap places
 Image Added Image Added
|
 Image Added Image Added
| Z key Use the 'z' key to copy configured elements with in your KPI - Hold the Z key
- Drag a configured element onto another Configure Box to copy the content across
|
...


