...
Once you've added a kpi you'll want need to start customising it strait away.
-first youll First you'll need to take hte the KPI out of seemless seamless mode if it is not all ready buy clicking the two arrows in cirled circled in red.
-Then toggel edit mode on
...
-Once edit mode is on you have two ways to configure ur you KPI envormentenvironment
- Grid Format
- Open canves
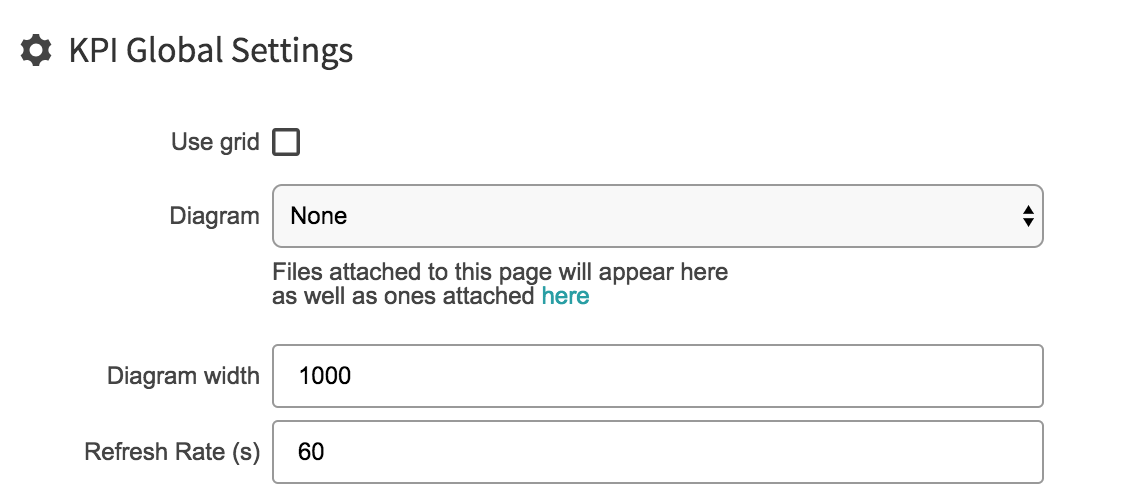
select the setting cog
...
so here are the two styles use grid and dont don't use grid
If you tick grid it will bring up a grid format where u you can display data in a tabled format
...
If you untick grid you can freely place and move around your kpi objects
-use Use add button to add elements to your kpi
...
With the no grid format you can import images and back ground images (ie svg diagrams, tecnical technical drawings etc) to go behind it and place ur you data on top of it like so
...
To save your work Click save and if you arnt are not happy with what you have done you can click revert to go back to its last save
...