Table of Contents
| Table of Contents | ||
|---|---|---|
|
Overview
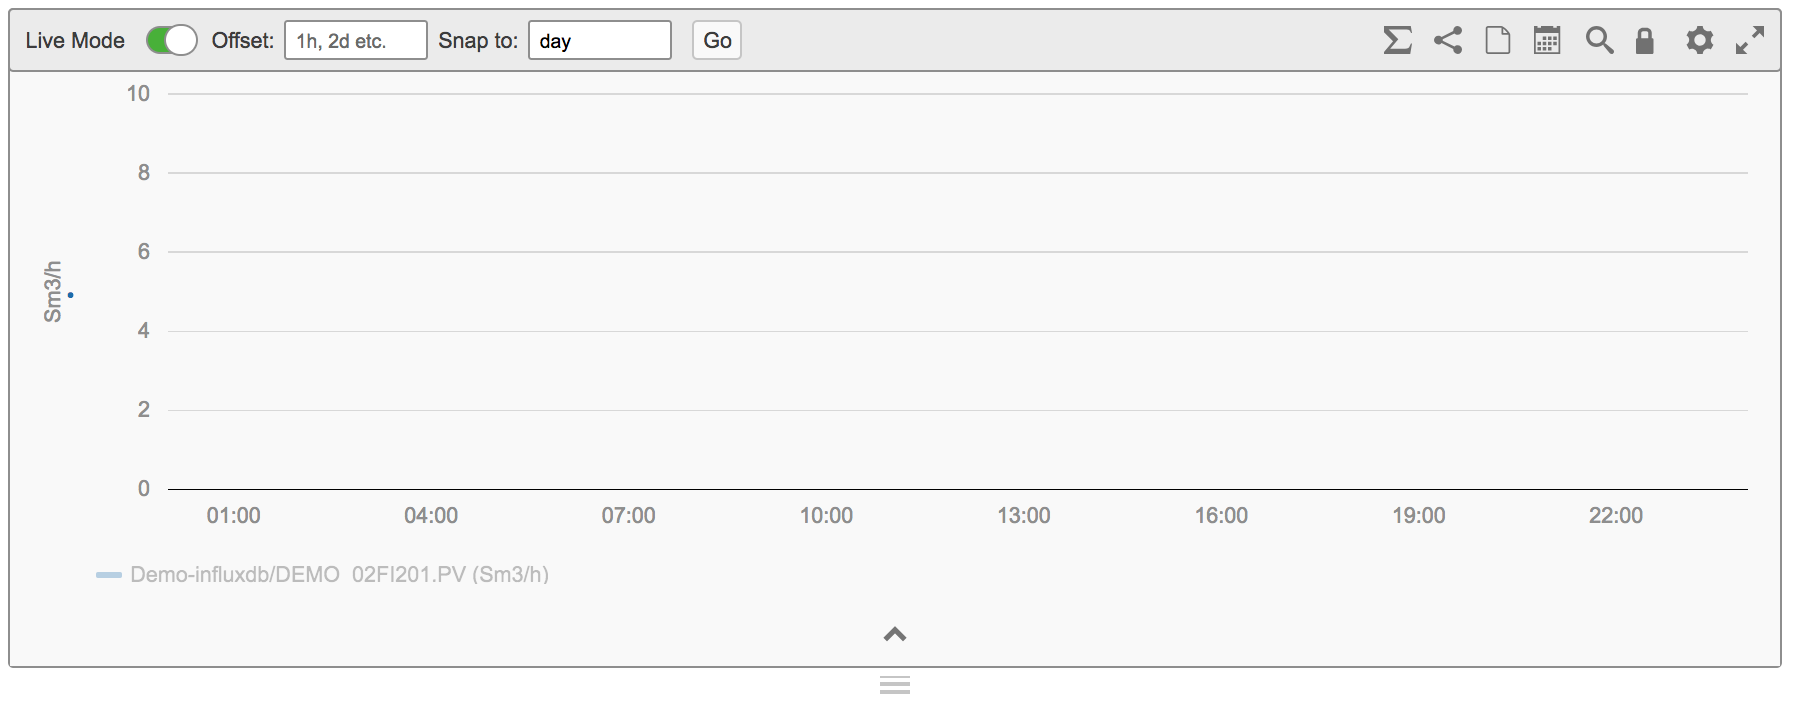
The Chart Macro. Create one or more interactive trends with different y-axes, scales, time ranges and layouts.
To insert a chart select "Chart" from the insert menu. Below are some starting hints. Don't forget to try out both left and right mouse clicks to see what's there.
You can add tags by either dragging and dropping them from elsewhere, for example either from search results or from the Basket or by manually adding them via the "Add Tags" option in the settings menu. Use the lock icon to lock and unlock the trend area so you can zoom and scroll axis (time and magnitude).
Have a look at the other configuration options in the settings button. Click on the arrow at the bottom to view the detailed legend where you can change series colours and axes and change the data and plot types.
The  handle at the bottom of the trend lets you change the height.
Chart Tools
| |
Share The whole Chart
|
|
Create Page Using Whole Chart
|
|
Seamless Mode
| Put The whole Chart macro into seamless mode. Seamless mode removes all the editing tools and only displays the chart on the page. |
Edit Config
| Edit Config. This allows you to see the config file behind the trend. Copy this and paste it into a text editor to make larger changes. |
Edit Tags
| Edit Tags - Used for defining a template version |
Change Chart Hight
| Changes the hight and the width of the whole chart
|
Edit Variables
| Edit Variables
|
Chart Layout
| Chart Layout
|


Individual Trend Tools
These Tools edit individual Trends where as the tools above will edit all the charts if you have set multiple charts to be displayed
| |
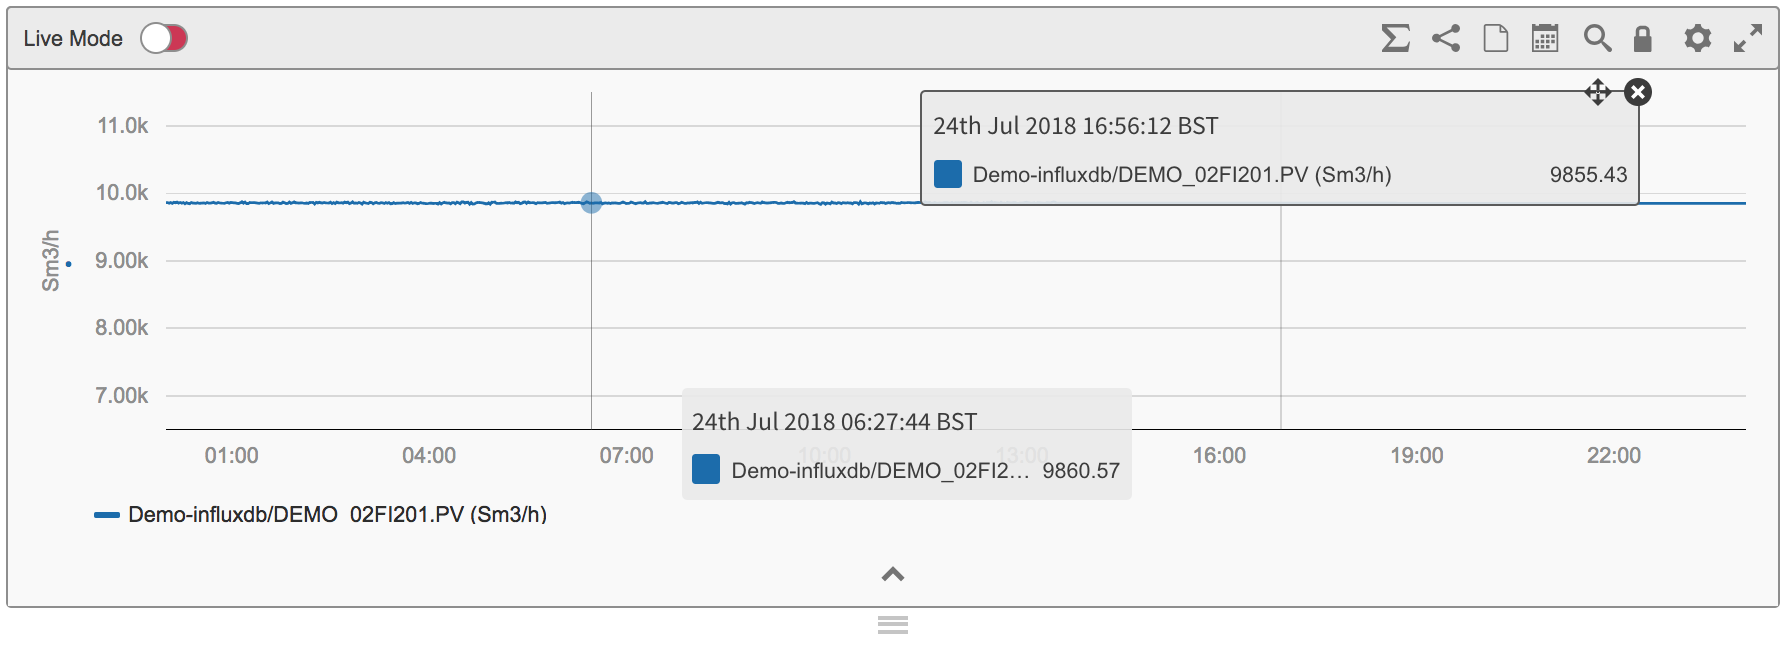
Live Mode
|
|
Offset
|
|
Snap To
| Snaps the trends X axis to a time period. Valid syntax - hour, day, month , year (no numbers are valid only the words) |
Scatter Plot
| Changes the trend to a scatter plot. Check how how two tags data relates. |
Share Individual Trend
| Shares this individual trend Trend. Creates this trend in the temporary space that can be shared with other users. - Eigen Temporary Space |
Create Page Using Trend
| Creates a page in the temporary space with this individual trend. Creates a page with this trend on it in the temporary space. This page can be modified and moved in your personal space or moved into a production space. - Eigen Temporary Space |
Timespan
| Use a set time span from a start time to a end time or use a time span of a specific time period such as one day or five hours. Valid syntax is minutes hours and days with a value in front of it 1m, 1h, 1d
|
Full Screen Pop Up
| Opens the trend in a full screen pop up window |
Trend Lock
| Use to lock and unlock the trend area so you can zoom and scroll axis (time and magnitude). |
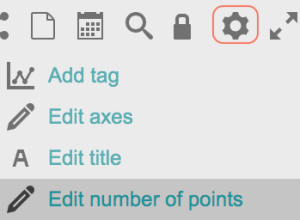
Trend Settings
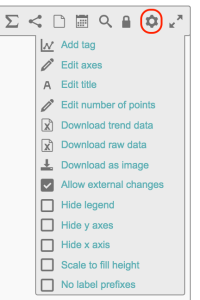 | Opens up the trend settings Add Tag Edit Title Edit Number of Points Download Trend Data Download Raw Data Download As Image
Allow External Changes Hide Legend Hide y-axis Hide x-axis Scale to Fill Height No Label Prefixes Here You can:
|
Individual Seamless Mode
| Puts the trend into seamless mode |
Add Tag
| Add a tag to the chart, either drag from an additional trend or from a KPI or form the basket. Or add a tag under setting cog "Add tag" |


Editing The Plot
To edit a trend line click the arrow up to bring up the trend configure
| ||||
Coloured square | Allows you to change the colour of the trend line. Change the weight of the line Change the style of the trend line |
| ||
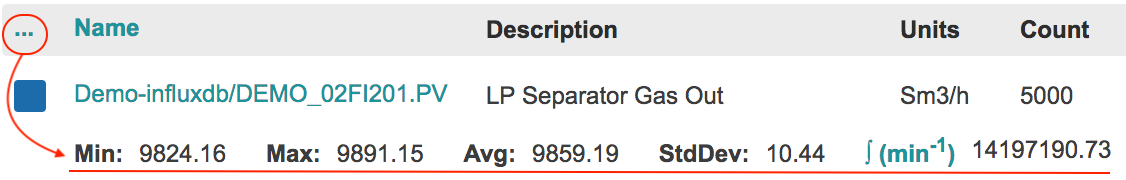
| ••• (trend Statistics) | Three Dots next to Name Reveal the trend statistics
Cycle thought pre sec/min/hr/day by clicking on
To do this Follow the two simple steps:
| |||
Name | Tag Name | |||
Description | Meta data descriptiont | |||
Units | Meta Data tag Units | |||
Count |
| |||
Format | auto, normal, scientific | |||
Axis | left 0, left 1, left 2 Right 0, Right 1, Right 2 | Moves the trend onto different axis. Trend multiple tags using different axis for each category of data | ||
Data Type | Interpolated, Raw, auto | |||
Plot Type | smooth, stepped before, stepped after | |||
End Date | any, custom | Set an end date for a trend | ||
Trash Can | Removes the Trend from the chart | |||


Right Clicking On The Tag Name
| |
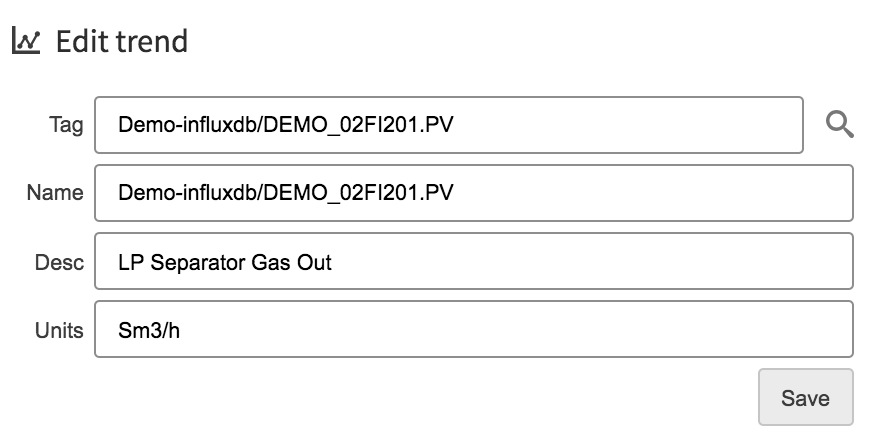
Edit | Allows you to edit the trend. Change the name that is displayed in the X axis and edit its description and units
|
Edit Calc | Opens up the calculation editor if trending a calculation |
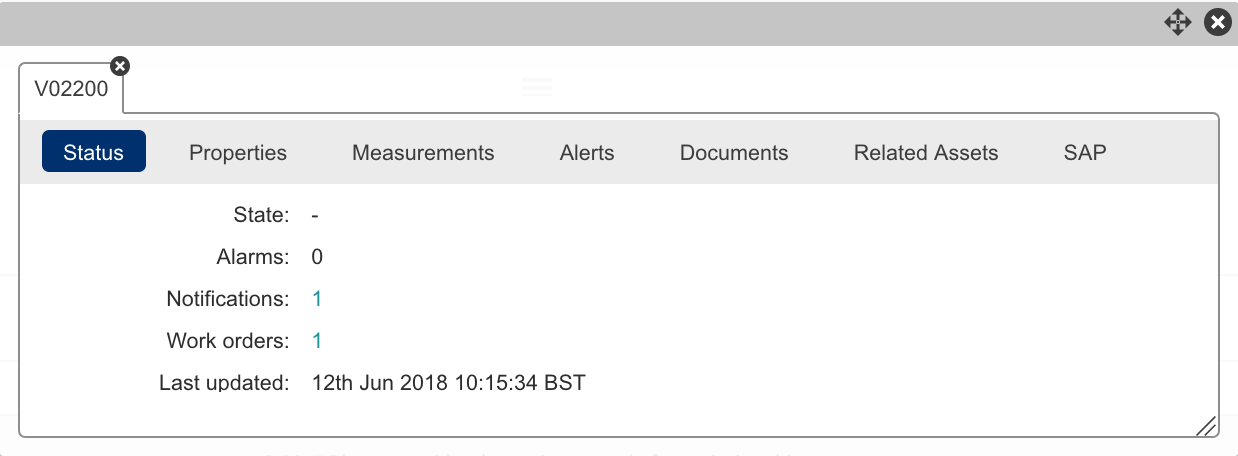
Common Menu | Brings up the common menu for its parent asset of the tag
|
Add to Basket | Adds the trend to the basket |
Add alias | |
Sunburst | |
Trend | Opens a full screen pop up of the that individual trend thats been selected |
add Trend AVG | Plots a trend that shows the average in the past 10 minutes (SLIDINGAGG(Demo-influxdb/DEMO_02FI201.PV,AVG,10m) |
Add Trend MIN | Plots a trend that shows the Minimum in the past 10 minutes (SLIDINGAGG(Demo-influxdb/DEMO_02FI201.PV,MIN,10m) |
Add Trend MAX | Plots a trend that shows the Maximum in the past 10 minutes (SLIDINGAGG(Demo-influxdb/DEMO_02FI201.PV,MAX,10m) |
Add Trend STDDEV | Plots a trend that shows the Standard Deveration in the past 10 minutes (SLIDINGAGG(Demo-influxdb/DEMO_02FI201.PV,STDDEV,10m) |
Copy to Local Trend | |
Remove Trend | Removes trend from chart |
Edit Limits | Allows you to edit or create new limit alerts for this tag or calculation |
Edit Labels | |

Right Clicking On The Trend Line
| |
Add Tag | Add another trend to the chart |
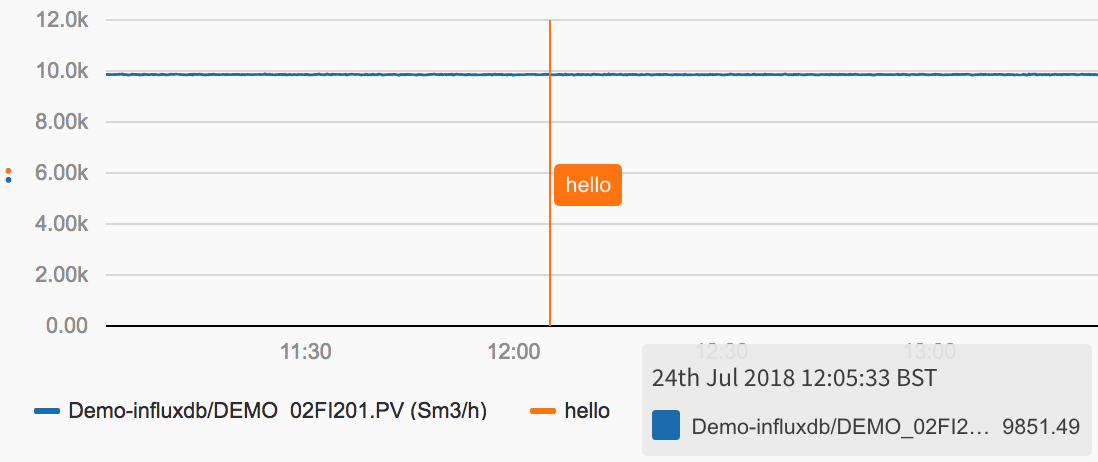
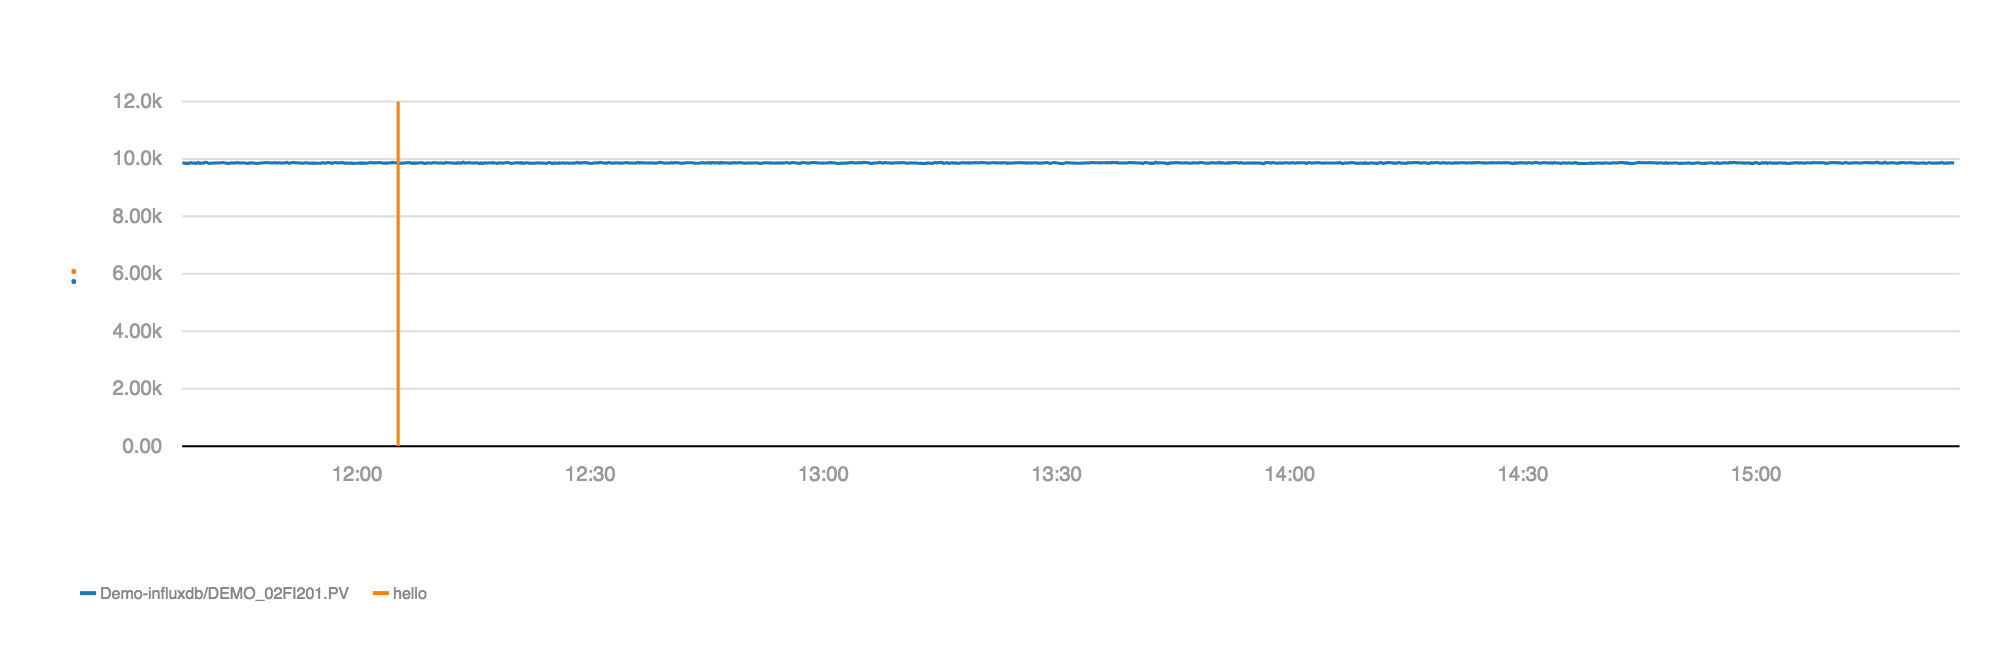
Add Marker | Adds a marker to the chart at the time stamp your curser was at
|
Add all to basket | Adds all the trends on this chart into the basket |
edit axes | Edit the Y axis Edit |
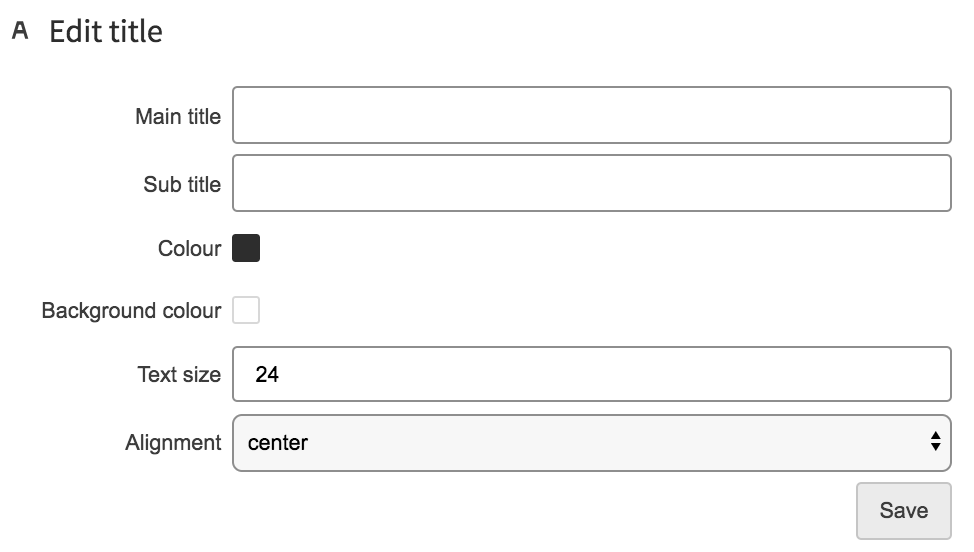
Edit Title | Allows you to add a title and a sub title
|
Download Trend Data | Down loads the trend data that is being displaying on the chart in the format selected |
Download Raw Data | Down loads the the actual raw data thats been entered from the historian |
Download as Image | Downloads a png image of the chart
|

Tips
- Pressing the space bar with your curser on the chart will take a snap shot of the data at that time and display a pop of it that can be moved around.
- Clicking on the trend will remove it from the display until you re click on it.